
Index
- Introduction
- Executive Summary: Acme Solar Holdings Scorecard
- Business Model Overview & IPP Positioning
- Fundamental Financial Analysis (Q1 FY27 & Multi-Year Growth)
- GW Operational Portfolio & BESS Storage Roadmap
- Multi-Timeframe Technical Chart Analysis & Indicators
- Valuation Benchmarking vs. Industry Peers
- Key Growth Catalysts & Future Projections (2026 – 2030)
- SWOT Analysis & Risk Management Framework
Acme Solar Holdings Analysis: Financials, Chart & Target
 By Admin
|
Sep 05, 2026
|
1 min read
|
2
|
🤍
0
By Admin
|
Sep 05, 2026
|
1 min read
|
2
|
🤍
0
The Indian green energy sector is undergoing an accelerated structural transformation, driven by massive national mandates for Firm and Dispatchable Renewable Energy (FDRE) and Battery Energy Storage Systems (BESS). Standing at the forefront of this transition is ACME Solar Holdings Limited (BSE: 544284 / NSE: ACMESOLAR), one of India’s premier renewable energy Independent Power Producers (IPPs).
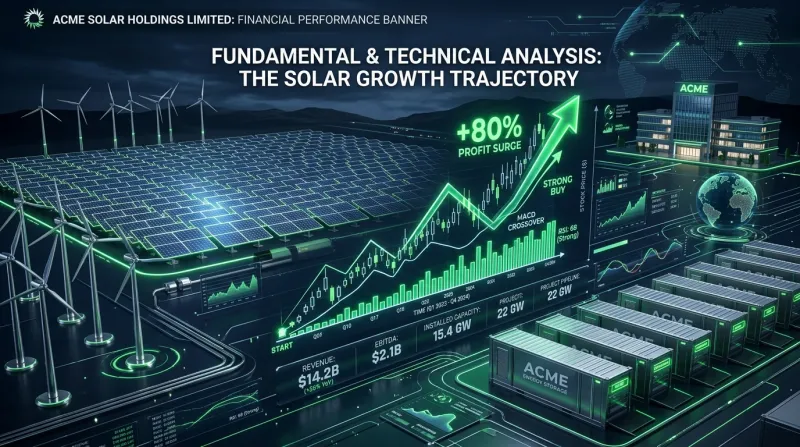
Following a stellar Q1 FY27 financial performance—where net profit (PAT) surged 80% YoY to ₹235.33 Crore on revenue of ₹954 Crore (+63% YoY)—the stock has demonstrated strong upward momentum, touching fresh 52-week highs near ₹430.00.
Supported by a ₹2,800 Crore QIP capital raise, a 7.39 GW locked-in project portfolio, and a near-term target to commission over 10 GWh of battery storage by FY27, Acme Solar is positioning itself as a round-the-clock (RTC) green power provider.
In this deep-dive research report on Investalks.in, we provide a complete fundamental and technical analysis of Acme Solar Holdings Ltd, evaluating quarterly financial performance, operational GW capacity scaling, balance sheet de-leveraging, technical chart posture, valuation benchmarking, and 2030 future growth projections.
Executive Summary: Acme Solar Holdings Scorecard
| Financial & Operational Metric | Current Value (September 2026) | Recent YoY Growth Performance |
|---|---|---|
| Market Capitalization (Cr) | ~₹29,547 Crore ($3.55 Billion) | Strong Capital Re-rating 🟢 |
| Current Share Price | ~₹415.00 – ₹430.40 | Trading near 52-Week High 📈 |
| Q1 FY27 Revenue from Ops | ₹954.00 Crore | +63.0% YoY Surge 🟢 |
| Q1 FY27 Net Profit (PAT) | ₹235.33 Crore | +80.0% YoY Surge 🟢 |
| Q1 FY27 EBITDA / Margin | ₹831.00 Crore (~87.1% Margin) | +56.0% YoY Surge 🟢 |
| Operational Capacity (GW) | ~2.90 GW | Expanding to 7.39 GW Portfolio ⚡ |
| Operational BESS Capacity | ~3.62 GWh | Target: 10+ GWh by FY27 🔋 |
| June 2026 QIP Fundraise | ₹2,800 Crore | Equity Infusion & Debt De-leverage |
Business Model Overview & IPP Positioning
ACME SOLAR INTEGRATED BUSINESS MODEL
Utility-Scale Solar PV ───► 2.9 GW Operational Solar Assets across high-irradiance states.
Solar-Wind Hybrid / FDRE ───► 24/7 Firm & Dispatchable Renewable Energy for SECI & NTPC.
Battery Storage (BESS) ───► Monetizing peak tariff spreads with 10+ GWh storage roadmap.
Green Hydrogen / Ammonia ───► Long-term option value via export projects in Odisha & TN.
Incorporated as an end-to-end green energy Independent Power Producer (IPP), Acme Solar Holdings Limited develops, builds, owns, operates, and maintains utility-scale renewable power plants:
- Utility-Scale Solar PV Plants: Operates 2.9 GW of solar assets across Rajasthan, Gujarat, Madhya Pradesh, and Andhra Pradesh, secured under long-term 25-year Power Purchase Agreements (PPAs) with central counterparties like SECI and NTPC.
- Firm & Dispatchable Renewable Energy (FDRE): Transitions from plain vanilla solar to high-margin hybrid plants combining solar, wind, and battery storage to supply firm, peak-hour green power.
- Battery Energy Storage Systems (BESS): Solves solar curtailment issues by storing excess daytime energy and discharging during peak evening hours when tariffs command a premium.
- Green Hydrogen & Ammonia Projects: Developing green ammonia manufacturing hubs in coastal Odisha and Tamil Nadu for export to European and Asian markets.
Fundamental Financial Analysis (Q1 FY27 & Multi-Year Growth)
| Financial Metric | Q1 FY26 | Q1 FY27 | YoY Performance |
|---|---|---|---|
| Revenue from Operations (₹ Cr) | ₹585.0 Cr | ₹954.0 Cr | +63.0% YoY 🟢 |
| Net Profit (PAT) (₹ Cr) | ₹130.7 Cr | ₹235.33 Cr | +80.0% YoY 🟢 |
Key Financial Highlights (Q1 FY27 / June 2026 Quarter):
- Revenue Surge: Operations revenue expanded +63.0% YoY to ₹954.00 Crore, driven by new capacity commissioning and higher plant load factors (PLF).
- PAT Compounding: Profit after tax (PAT) jumped +80.0% YoY to ₹235.33 Crore, demonstrating strong operating leverage.
- Industry-Leading EBITDA: Quarterly EBITDA reached ₹831.00 Crore, maintaining EBITDA margins near ~87.1%.
- Capital Infusion via QIP: In June 2026, the company successfully raised ₹2,800 Crore through a Qualified Institutional Placement (QIP), deploying funds to retire high-cost project debt and finance greenfield BESS projects. Track complete financial breakdowns on Investalks.in Fundamental Analysis.
GW Operational Portfolio & BESS Storage Roadmap
| Capacity Metric | Current | Near-Term / Locked-in | 2030 Target |
|---|---|---|---|
| Solar Operational Capacity | 2.9 GW | 7.39 GW Locked-in Portfolio | 10.0 GW |
| BESS Capacity | 3.62 GWh | 10.0+ GWh by FY27 | 25.0 GWh |
- Generation Capacity (GW):
- Current Operational Base: ~2.90 GW
- Total Locked-in Portfolio: 7.39 GW (Under construction & pre-construction phases).
- Long-Term 2030 Target: 10.0 GW operational portfolio.
- Battery Energy Storage Systems (BESS):
- Current Operational Storage: ~3.62 GWh
- FY27 Commissioning Target: 10.0+ GWh (One of India's largest corporate storage footprints).
- 2030 Storage Target: 25.0 GWh storage capacity.
Multi-Timeframe Technical Chart Analysis & Indicators
TECHNICAL CHART LEVEL MAPPING (NSE SPOT)
₹450 – ₹480 ── Resistance 1 (Breakout Target Zone)
₹430.40 ── 52-Week Intraday High
₹395.00 ── 20-Day EMA Dynamic Support
₹415.00 === CURRENT SPOT: ~₹415
₹365.00 ── 50-Day EMA Major Structural Base
A. Moving Average Ribbons (EMA Confluence):
- 20-Day EMA: Sits at ₹395.00, providing dynamic short-term support.
- 50-Day EMA: Sits at ₹365.00, acting as major structural trend support.
- 100-Day EMA: Sits at ₹325.00.
- 200-Day EMA: Sits at ₹280.00, representing the long-term bull market floor.
B. Momentum Oscillators:
- Relative Strength Index (RSI 14): Daily RSI stands at 66.50, reflecting strong bullish momentum without entering extreme overbought territory (>75).
- MACD (12, 26, 9): Line remains above the Signal Line with positive histogram expansion, confirming sustained buying interest. Explore indicator guides on Investalks.in Technical Indicators Hub.
C. Key Technical Levels:
- Immediate Technical Support: ₹390.00 – ₹400.00 (20-Day EMA & Retest Base).
- Major Structural Support: ₹360.00 – ₹365.00 (50-Day EMA Floor).
- Immediate Resistance Target: ₹450.00 – ₹480.00 (Fibonacci Expansion Zone).
Valuation Benchmarking vs. Industry Peers
| Company Name | Market Cap (₹ Cr) | Annual PAT (Est. FY27) | Trailing P/E Multiple |
|---|---|---|---|
| Acme Solar Holdings | ~₹29,547 Cr | ~₹940.00 Cr | ~31.40x (ATTRACTIVE) |
| Adani Green Energy Ltd | ~₹2,85,000 Cr | ₹1,650.00 Cr | ~172.00x |
| NTPC Green Energy Ltd | ~₹1,15,000 Cr | ₹1,250.00 Cr | ~92.00x |
| Tata Power Company Ltd | ~₹1,35,000 Cr | ₹4,200.00 Cr | ~32.10x |
Key Growth Catalysts & Future Projections (2026 – 2030)
| Growth Catalyst | Key Growth Driver / Explanation |
|---|---|
| 1. BESS Tariff Monetization | Discharging stored solar power at premium evening peak tariffs. |
| 2. 7.39 GW Execution | Commissioning 4.5 GW under-construction assets by FY27. |
| 3. Debt Cost Savings | ₹2,800 Cr QIP proceeds reduce finance costs, boosting PAT. |
- High-Margin BESS Monetization: Discharging stored solar energy during peak evening hours allows Acme Solar to realize higher real-time power tariffs compared to standard baseload solar PPAs.
- Execution of 4.5 GW Pipeline: Commissioning 4.5 GW of under-construction hybrid assets by FY27 is projected to double annual operating revenues.
- Refinancing & Interest Savings: Retiring high-cost debt using ₹2,800 Cr QIP capital will save ~₹220–250 Crore in annual interest costs, directly expanding net profit margins.
SWOT Analysis & Risk Management Framework
| Strengths | Weaknesses |
|---|---|
| • 80% YoY PAT surge & 87% EBITDA margin. | • Capital-intensive renewable capex requirement |
| • Industry-leading 10+ GWh BESS storage roadmap. | • High dependency on SECI/NTPC PPA execution. |
| • Attractive P/E (31.4x) vs peer IPP multiples. | — |
| Opportunities | Threats |
|---|---|
| • 24/7 Firm & Dispatchable green power tenders. | • Transmission grid curtailment risks. |
| • Green Hydrogen / Green Ammonia export market. | • Solar PV module price fluctuations. |
❓ Frequently Asked Questions (FAQs)
Acme Solar reported a 63% YoY surge in revenue to ₹954 Crore and an 80% YoY jump in net profit (PAT) to ₹235.33 Crore, with quarterly EBITDA reaching ₹831 Crore (~87.1% margin).
The company is targeting an operational generation portfolio of 10.0 GW and a Battery Energy Storage System (BESS) capacity of 25.0 GWh by 2030.
- Immediate Technical Support: ₹390.00 – ₹400.00 (20-Day EMA)
- Major Structural Support: ₹360.00 – ₹365.00 (50-Day EMA)
- Upside Resistance Target: ₹450.00 – ₹480.00
Financial & Regulatory Disclaimer
InvesTalks provides stock market analysis, equity research, and financial content strictly for educational and informational purposes only. We are not a SEBI-registered investment advisor or portfolio manager. Market investments are subject to market risks. Always perform your own research or consult a certified SEBI-registered financial advisor before making buy/sell decisions.
Admin
Equity Research & Financial AnalysisCurated by the InvesTalks financial analysis team. Dedicated to providing disciplined stock market insights, technical chart evaluations, and long-term investor education.
 Market News & Outlook

Login to comment.