
Index
- Introduction
- Executive Summary: HDFC Life Insurance Scorecard
- Special Focus: Today's Stock Movement (#1 Top Gainer on Nifty 50)
- Integrated Business Model & Distribution Architecture
- Fundamental Financial Analysis (APE, VNB Margins & Solvency Ratio)
- Multi-Timeframe Technical Chart Analysis & Indicators
- Valuation Benchmarking vs. Life Insurance Peers
- Key Growth Catalysts & Future Projections (2026 – 2030)
- SWOT Analysis & Risk Management Framework
HDFC Life Analysis: #1 Nifty Gainer Today (+2.4%), Target
 By Admin
|
Sep 10, 2026
|
1 min read
|
6
|
🤍
0
By Admin
|
Sep 10, 2026
|
1 min read
|
6
|
🤍
0
The Indian life insurance sector is witnessing a structural transition, fueled by expanding bancassurance networks, growing demand for non-participating (Non-PAR) savings products, and increasing digital adoption. Leading this expansion is HDFC Life Insurance Company Limited (NSE: HDFCLIFE | BSE: 540777 | ISIN: INE795G01014), one of India’s premier private life insurers.
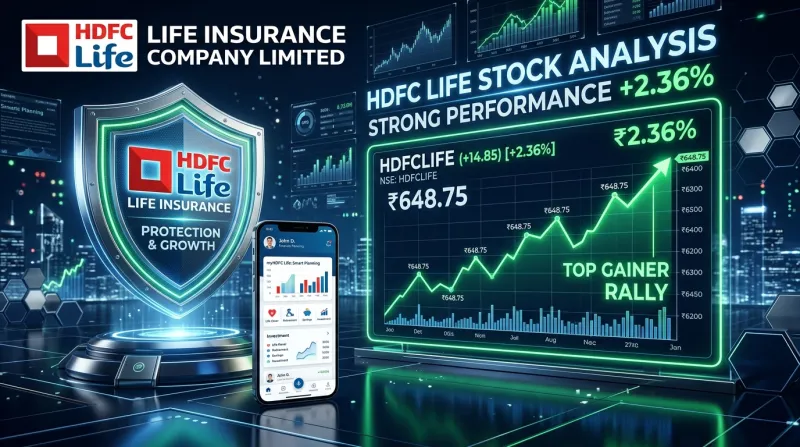
On Thursday, September 10, 2026, HDFC Life emerged as the #1 Top Gainer on the Nifty 50 index, surging +2.36% to close at ₹526.15 per share on heavy trading volume (over 4.04 million shares traded on the NSE). This rally helped snap a three-day losing streak for domestic benchmarks.
Supported by strong operational metrics—including a 9% YoY growth in Annualised Premium Equivalent (APE) to ₹3,515 Crore, a 9% YoY rise in Value of New Business (VNB) to ₹879 Crore, and resilient 25.0% VNB margins—HDFC Life continues to leverage its deep distribution tie-up with HDFC Bank post-merger.
In this deep-dive research report on Investalks.in, we present a complete fundamental and technical analysis of HDFC Life Insurance Company Ltd, focusing on today's price surge, VNB/APE growth metrics, bancassurance synergies, technical chart indicators, valuation benchmarking, and 2030 future growth projections.
Executive Summary: HDFC Life Insurance Scorecard
| Financial & Operational Metric | Current Value (September 10, 2026) | Recent Performance / Event |
|---|---|---|
| Market Capitalization (Cr) | ~₹1,13,200 Crore ($13.6 Billion) | Large-Cap Insurance Leader 🟢 |
| Current Share Price | ₹526.15 per share | #1 Top Gainer Today (+2.36%) |
| Q1 FY27 APE (Premium) | ₹3,515.00 Crore | +9.0% YoY Growth 🟢 |
| Q1 FY27 VNB (Value New Biz) | ₹879.00 Crore | +9.0% YoY Growth 🟢 |
| Value of New Business Margin | 25.0% VNB Margin | Resilient Profitability Base |
| Solvency Ratio | ~185% | Well above 150% min threshold |
| Key Distribution Driver | HDFC Bank Network Integration | 8,000+ Branch Bancassurance |
Special Focus: Today's Stock Movement (#1 Top Gainer on Nifty 50)
TODAY'S STOCK PERFORMANCE HIGHLIGHTS
Closing Price: ₹526.15 ──► Gained +2.36% (+₹12.10) on NSE.
#1 Nifty 50 Outperformer ──► Led financial services sector recovery (+0.56%).
NSE Volume: 4.04M Shares ──► Heavy institutional accumulation into the close.
1. Market Outperformance (September 10, 2026)
- On a day when Nifty 50 recorded a modest +0.20% gain to snap a 3-day losing streak, HDFC Life Insurance emerged as the top performer on the Nifty 50 index, surging +2.36% to close at ₹526.15 per share.
2. Primary Catalysts Driving Today's Demand
- Bancassurance Momentum: Institutional buying accelerated following reports of expanding insurance cross-selling across HDFC Bank’s 8,000+ branch footprint.
- Resilient VNB Margins: Investor sentiment remains supported by HDFC Life's 25.0% VNB margin, which absorbed recent tax adjustments while maintaining profitability across Non-PAR and individual protection lines. Track daily market wraps on Investalks.in Market Wrap Hub.
Integrated Business Model & Distribution Architecture
HDFC LIFE MULTI-CHANNEL DISTRIBUTION ECOSYSTEM
Bancassurance (HDFC Bank) ──► Primary growth engine leveraging 8,000+ bank branches.
Agency Network ──► Expanded tied-agent network serving Tier-2/3 geographies.
Direct-to-Consumer (D2C) ──► Proprietary HDFC Life Mobile App & online portal.
Broker Partnerships ──► Strategic tie-ups with leading digital brokers & platforms.
HDFC Life operates a diversified distribution ecosystem:
- Bancassurance (HDFC Bank & Partner Banks): HDFC Bank remains the primary distribution partner, enabling access to millions of retail banking customers.
- Proprietary Agency & Direct Channels: A growing network of tied agents and corporate partners provides nationwide reach across semi-urban clusters.
- Digital & InsurTech Integration: D2C digital platforms offer instant policy issuance, automated underwriting, and seamless claims processing.
Fundamental Financial Analysis (APE, VNB Margins & Solvency Ratio)
HDFC LIFE Q1 FY27 OPERATIONAL METRICS
Annualised Premium Equivalent (APE): ₹3,515.00 Cr (+9.0% YoY Growth!)
Value of New Business (VNB): ₹879.00 Cr (+9.0% YoY Growth!)
VNB Margin: 25.0% (Resilient Margin Profile)
Solvency Ratio: 185% (Strong Balance Sheet Cushion)
Key Operational Metrics (Q1 FY27):
- APE Growth (+9.0% YoY): Total Annualised Premium Equivalent reached ₹3,515.00 Crore, driven by strong demand for Unit Linked Insurance Plans (ULIPs), non-par savings, and individual protection plans.
- VNB Expansion (+9.0% YoY): Value of New Business expanded to ₹879.00 Crore, reflecting high-margin product sales.
- Resilient VNB Margin (25.0%): VNB margin held firm at 25.0%, absorbing input tax credit shifts through favorable product mix optimization.
- Solvency Capital Strength (185%): Solvency ratio stands at ~185%, well above the regulatory minimum of 150%, providing capital capacity for future growth. Track complete fundamental breakdowns on Investalks.in Fundamental Analysis.
Multi-Timeframe Technical Chart Analysis & Indicators
TECHNICAL CHART LEVEL MAPPING (NSE: HDFCLIFE)
₹565.00 ── 200-Day EMA Long-Term Overhead Target
₹545.00 ── 100-Day EMA Resistance Level
₹532.00 ── 50-Day EMA Immediate Hurdle
₹526.15 === TODAY'S CLOSE: ₹526.15 (+2.36% Outperformer!)
₹520.00 ── 20-Day EMA Dynamic Support Base
A. Moving Average Ribbons (EMA Confluence):
- 20-Day EMA: Reclaimed today at ₹520.00, providing short-term support.
- 50-Day EMA: Sits at ₹532.00, representing the immediate overhead resistance level.
- 100-Day EMA: Sits at ₹545.00.
- 200-Day EMA: Sits at ₹565.00, marking the long-term trend baseline.
B. Momentum Oscillators:
- Relative Strength Index (RSI 14): Daily RSI expanded to 54.20, confirming a bullish momentum crossover off oversold levels.
- MACD (12, 26, 9): Line turned upward toward a positive crossover, supported by expanding green histogram bars. Explore technical chart guides on Investalks.in Technical Indicators Hub.
C. Key Technical Levels:
- Immediate Technical Support: ₹515.00 – ₹520.00 (20-Day EMA Support Base).
- Major Structural Support: ₹500.00 – ₹505.00 (Multi-Month Demand Floor).
- Immediate Resistance Target: ₹532.00 – ₹545.00 (50-Day & 100-Day EMA Zone).
- Long-Term Price Target: ₹565.00 – ₹585.00.
Valuation Benchmarking vs. Life Insurance Peers
| Company Name | Market Cap (₹ Cr) | ISIN Code | Q1 APE Growth (YoY) |
|---|---|---|---|
| HDFC Life Insurance | ~₹1,13,200 Cr | INE795G01014 | +9.0% (25.0% Margin) |
| SBI Life Insurance Co Ltd | ~₹1,75,000 Cr | INE123W01016 | +11.2% (26.8% Margin) |
| ICICI Prudential Life Co | ~₹88,000 Cr | INE726G01019 | +8.5% (24.2% Margin) |
| Max Financial Services | ~₹38,000 Cr | INE180A01020 | +10.1% (24.8% Margin) |
Key Growth Catalysts & Future Projections (2026 – 2030)
| Growth Catalyst | Key Growth Driver / Explanation |
|---|---|
| 1. HDFC Bank Branch Scaling | Deepening insurance cross-sell across 8,000+ bank branches. |
| 2. Non-PAR & Annuity Mix | Expanding high-margin non-par savings & pension annuities. |
| 3. Digital Underwriting | Scaling automated D2C issuance via proprietary digital apps. |
- HDFC Bank Bancassurance Expansion: Expanding insurance penetration across HDFC Bank's 8,000+ branches will drive double-digit APE growth over the next 3 to 5 years.
- High-Margin Product Mix: Increasing the share of Non-PAR savings products, retirement annuities, and individual protection plans will support stable 25%+ VNB margins.
- Digital Automation: Enhancing AI-driven underwriting and claims processing will lower customer acquisition costs and improve operational efficiency.
SWOT Analysis & Risk Management Framework
| Strengths | Weaknesses |
|---|---|
| • Strong brand backing from HDFC Group. | • Sensitivity to capital market volatility (ULIPs). |
| • Premier bancassurance partnership with HDFC Bank. | • Short-term margin pressure from tax changes. |
| • Resilient 25.0% VNB margin & 185% Solvency. | — |
| Opportunities | Threats |
|---|---|
| • Low life insurance penetration in Tier-2/3 India. | • Regulatory cap adjustments on surrender values. |
| • Growing demand for retirement annuities. | • Intensifying competition from private peers. |
❓ Frequently Asked Questions (FAQs)
HDFC Life shares rose +2.36% to close at ₹526.15, emerging as the #1 Top Gainer on the Nifty 50 index, driven by institutional buying and strong bancassurance distribution metrics.
HDFC Life reported a 9% YoY growth in APE to ₹3,515 Crore and a 9% YoY growth in VNB to ₹879 Crore, maintaining a VNB margin of 25.0%.
The ISIN code for HDFC Life Insurance Company Limited is INE795G01014 (NSE: HDFCLIFE / BSE: 540777).
HDFC Life maintains a solvency ratio of ~185%, well above the minimum regulatory requirement of 150%.
- Immediate Technical Support: ₹515.00 – ₹520.00 (20-Day EMA)
- Major Structural Support: ₹500.00 – ₹505.00
- Upside Resistance Target: ₹532.00 – ₹545.00 (50/100-Day EMA) & ₹565.00
Financial & Regulatory Disclaimer
InvesTalks provides stock market analysis, equity research, and financial content strictly for educational and informational purposes only. We are not a SEBI-registered investment advisor or portfolio manager. Market investments are subject to market risks. Always perform your own research or consult a certified SEBI-registered financial advisor before making buy/sell decisions.
Admin
Equity Research & Financial AnalysisCurated by the InvesTalks financial analysis team. Dedicated to providing disciplined stock market insights, technical chart evaluations, and long-term investor education.
 Market News & Outlook
Login to comment.