
Index
- Introduction
- Executive Summary Scorecard: September 17, 2026 Close
- Today's Nifty 50 Market Anatomy (Thursday, September 17, 2026)
- Macroeconomic Drivers & Global Catalysts
- Deep Multi-Indicator Technical Deconstruction
- Key Support & Resistance Level Grid for Friday, September 18, 2026
- Friday Market Predictions & Decision-Tree Scenarios (September 18, 2026)
- Actionable Strategy & Risk Management Guidelines
Nifty 50 Market Analysis Today (Sept 17: 23,270.60) & Friday Prediction: Key Levels & Indicators
 By Admin
|
Sep 17, 2026
|
1 min read
|
2
|
🤍
0
By Admin
|
Sep 17, 2026
|
1 min read
|
2
|
🤍
0
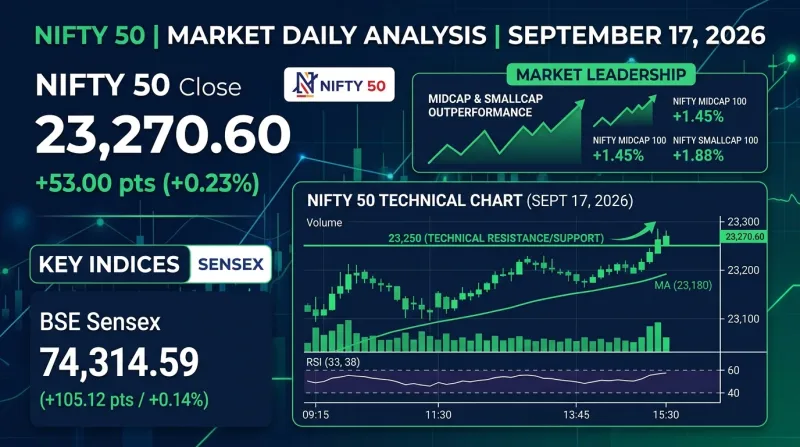
Indian equity benchmarks closed on a positive note on Thursday, September 17, 2026, as Nifty 50 gained 53.00 points (+0.23%) to settle at 23,270.60, up from its previous close of 23,217.60. While frontline indices saw a selective consolidation—with the BSE Sensex dipping marginally by 21.86 points (-0.03%) to 74,314.59—the broader market experienced robust buying interest. The Nifty Midcap 100 rose 0.9% and the Nifty Smallcap 100 surged 0.8%, reflecting strong risk-on momentum in growth equities.
This comprehensive market analysis provides an authoritative breakdown of today's price action across sectors, highlighting strong gains in Realty (+1.45%) and Pharma (+1.10%) alongside mild profit-taking in Nifty Bank. We examine the key primary drivers—including the opening of the landmark NSE IPO subscription and domestic mutual funds injecting +₹3,908.23 Crore in net institutional purchases.
Heading into Friday, September 18, 2026, this article evaluates deep multi-indicator technical setups—including a narrow Central Pivot Range (~5 points), 200-day EMA support floor (23,150–23,180), daily RSI recovery (41.50), Option Chain Put-Call Ratio (PCR 0.92), and a complete decision-tree scenario matrix to help traders and investors navigate Friday's session with confidence.
Executive Summary Scorecard: September 17, 2026 Close
| Market Metric / Index | Thursday Close (Sept 17, 2026) | Absolute Change | Percentage Change | Verified Technical & Market Observation |
|---|---|---|---|---|
| Nifty 50 Spot | 23,270.60 | +53.00 pts | +0.23% | Extended recovery above 23,250; High at 23,310.80 |
| BSE Sensex | 74,314.59 | -21.86 pts | -0.03% | Consolidated in a narrow range following closing auction session |
| Nifty Bank | 56,055.75 | -236.70 pts | -0.42% | Faced mild profit-taking after recent short-covering rally |
| Nifty Midcap 100 | 56,820.50 | +507.20 pts | +0.90% | Outperformed frontline benchmark with broad-based buying |
| Nifty Smallcap 100 | 18,450.30 | +146.40 pts | +0.80% | Strong retail participation across growth sectors |
| India VIX (Volatility Index) | 12.63 | -3.17 pts | -20.06% | Volatility dropped sharply, indicating calm market posture |
| FII Net Cash Flow (Sept 16) | -₹2,032.61 Cr | Net Sellers | Outflow | Foreign institutional selling absorbed by domestic institutions |
| DII Net Cash Flow (Sept 16) | +₹3,908.23 Cr | Net Buyers | Strong Cushion | Heavy domestic mutual fund accumulation in equities |
| Brent Crude Oil | $107.50 / bbl | Stable | Macro Monitor | High crude prices capped aggressive large-cap upside |
Today's Nifty 50 Market Anatomy (Thursday, September 17, 2026)
Indian equities demonstrated underlying resilience on Thursday, September 17, 2026, as Nifty 50 added 53.00 points (+0.23%) to close at 23,270.60, up from Wednesday's settlement of 23,217.60. Opening at 23,230.50, Nifty dipped to an intraday low of 23,215.20 before steady accumulation pushed the index to a session high of 23,310.80.
While large-cap banking heavyweights saw mild profit-taking—causing BSE Sensex to dip slightly by 21.86 points (-0.03%) to 74,314.59—broader market participation remained buoyant.
      Intraday Trajectory of Nifty 50 (Sept 17, 2026)

23,310 +----------------------------------------------+ Intraday High: 23,310.80
       |                                      *       |
23,270 |                                     ***      | Close: 23,270.60 (+53 pts)
       |                              *******   ***** |
23,230 |  * (Open: 23,230)     *******                |
       | ***                **                        |
23,215 +--------*------*------------------------------+ Low: 23,215.20
       9:15 AM   11:30 AM          1:45 PM     3:30 PM
Sectoral Performance Dynamics
- Outperformers: Nifty Realty (+1.45%) and Nifty Pharma (+1.10%) led sectoral gains, followed by selective buying in Auto and Metal names.
- Laggards & Consolidators: Nifty Bank (-0.30%) and Nifty Financial Services (-0.25%) consolidated in a narrow band following post-expiry position adjustments.
For real-time sectoral heatmaps and market breadth metrics, explore the InvesTalks Market Insights Hub.
Macroeconomic Drivers & Global Catalysts
Market dynamics on September 17 were driven by key primary catalysts:
- NSE IPO Subscription Launch: The mega NSE IPO opened for public subscription (price band ₹1,700–₹1,785), boosting capital market sentiment and driving interest across financial intermediaries. Track real-time subscription details on the InvesTalks IPO Radar.
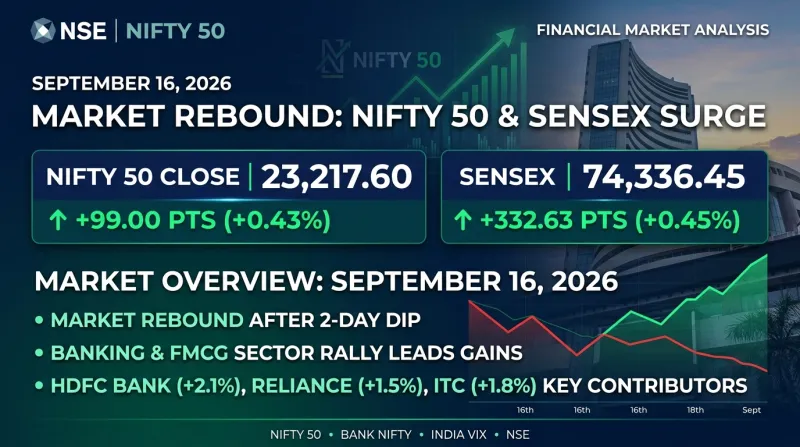
- Massive DII Institutional Absorption: Official exchange data finalized for the previous session (Sept 16) confirmed that Domestic Institutional Investors (DIIs) injected +₹3,908.23 Crore in net equity purchases, absorbing foreign outflows (-₹2,032.61 Crore).
- Sharp Drop in India VIX: Volatility dropped by -20.06% to 12.63, reflecting a decline in market anxiety and favoring range-breakout trading strategies.
Stay updated on macro trends via the InvesTalks Stock Market Blog.
Deep Multi-Indicator Technical Deconstruction
Our multi-indicator suite provides clear technical guidance heading into Friday, September 18, 2026:
1. Moving Average Hierarchy & Trend Alignment
- 200-Day EMA (23,150–23,180 Zone): Nifty 50 built a solid higher-low base above its 200-day EMA floor, confirming structural demand.
- 20-Day EMA (23,360) & 50-Day EMA (23,430): Act as dynamic overhead resistance hurdles on the daily timeframe.
2. Relative Strength Index (RSI - 14 Days)
- Daily RSI extended its recovery from oversold territory up to 41.50, confirming strengthening buying momentum with significant head-room for further upside expansion.
3. Central Pivot Range (CPR) for Friday, September 18
- Pivot Point (P): 23,265.53
- Bottom Central (BC): 23,263.00
- Top Central (TC): 23,268.06
- CPR Width: Ultra-Narrow CPR (~5 points). An ultra-narrow CPR indicates a high probability of a strong directional trend or momentum breakout session on Friday.
4. Option Chain Analysis & Put-Call Ratio (PCR)
- Put-Call Ratio (PCR): Shifted upward to 0.92, signaling neutral-to-bullish positioning as Put writers added contracts at 23,200 PE.
- Call Open Interest (Resistance): Highest Call OI concentrated at 23,350 CE (95 lakh shares) and 23,400 CE (1.15 crore shares).
- Put Open Interest (Support): Maximum Put OI positioned at 23,200 PE (1.20 crore shares) and 23,100 PE (1.05 crore shares).
        Nifty 50 Option Chain Open Interest Distribution

Call OI (Resistance)                   Put OI (Support)
[23,400 CE] ████████████████████ 115L
[23,350 CE] ███████████████ 95L
[23,300 CE] ████████ 48L
---------------------- [23,270 SPOT] ----------------------
                                       █████████████████████ 120L [23,200 PE]
                                       ████████████████ 105L [23,100 PE]
                                       ██████████ 65L [23,000 PE]
Analyze live option chain heatmaps and PCR shifts on the InvesTalks Nifty Option Chain Screener.
Key Support & Resistance Level Grid for Friday, September 18, 2026
| Level Type | Price Level (Pts) | Technical Justification & Market Context |
|---|---|---|
| Resistance 3 (R3) | 23,450 | 50-Day EMA Alignment & Major Breakdown Resistance |
| Resistance 2 (R2) | 23,380 | 20-Day EMA & Call Writer Wall |
| Resistance 1 (R1) | 23,310 | Immediate Intraday High (Sept 17) & Breakout Level |
| Pivot Point (P) | 23,265 | Daily Central Pivot Point |
| Support 1 (S1) | 23,215 | Immediate Intraday Demand Low (Sept 17) |
| Support 2 (S2) | 23,150 | 200-Day EMA Floor Support |
| Support 3 (S3) | 23,050 | Major Put Open Interest Base Floor |
Friday Market Predictions & Decision-Tree Scenarios (September 18, 2026)
Based on ultra-narrow CPR alignment and momentum recovery, we outline three probabilistic trading scenarios for Friday, September 18, 2026:

Scenario A: Bullish Trend Breakout (50% Probability)
- Trigger: A flat to positive opening allowing Nifty to hold above 23,270.
- Price Dynamics: A break above 23,310 (R1) triggers short-covering among call writers at 23,350 CE, driving a momentum push through the ultra-narrow CPR.
- Upside Targets: 23,310, extending toward 23,380 (R2).
Scenario B: Narrow Range Consolidation (35% Probability)
- Trigger: Flattish opening around 23,265 with option sellers anchoring 23,300 CE and 23,200 PE.
- Price Dynamics: The index consolidates within a tight corridor between 23,220 and 23,290.
- Target Range: 23,230 – 23,285.
Scenario C: Profit-Taking Pullback (15% Probability)
- Trigger: Sudden weakness in global markets or crude oil price spikes.
- Price Dynamics: A break below 23,215 (S1) leads to long unwinding down toward the 200-day EMA floor.
- Downside Targets: 23,150 (S2), extending to 23,050 (S3).
Explore advanced technical analysis tools on the InvesTalks Technical Analysis Portal.
Actionable Strategy & Risk Management Guidelines
For Options & Intraday Traders
- Bullish Setup: Enter long positions on a 15-minute candle closing above 23,285, targeting 23,330 and 23,380. Enforce a strict stop-loss below 23,210.
- Pullback Buying: Look for dip-buying opportunities near 23,215–23,230 if bullish reversal candlesticks form. Maintain a stop-loss below 23,170.
- Volatility Cushion: With India VIX cooling to 12.63, option premiums offer lower volatility drag for directional momentum setups.
For Long-Term Investors
- Nifty's sustained base building above the 200-day EMA (23,150–23,200) confirms structural market resilience. Continue systematic equity accumulation in high-quality large-cap and mid-cap market leaders.
❓ Frequently Asked Questions (FAQs)
Nifty 50 closed at 23,270.60, gaining 53.00 points (+0.23%), up from its previous close of 23,217.60.
Broader markets significantly outperformed frontline indices: the Nifty Midcap 100 gained +0.9% and the Nifty Smallcap 100 surged +0.8%.
The BSE Sensex closed at 74,314.59, dipping marginally by 21.86 points (-0.03%).
Nifty Realty (+1.45%) and Nifty Pharma (+1.10%) led sectoral gains, while banking stocks faced mild profit-taking (-0.30%).
Key support levels are S1: 23,215 (Intraday Low), S2: 23,150 (200-day EMA), and S3: 23,050.
Primary resistance levels are R1: 23,310 (Thursday High), R2: 23,380 (20-day EMA), and R3: 23,450 (50-day EMA).
On September 16, DIIs were strong net buyers of +₹3,908.23 Crore, absorbing FII net selling of -₹2,032.61 Crore.
The Central Pivot Point for Friday stands at 23,265.53, featuring an ultra-narrow CPR extending between 23,263.00 and 23,268.06.
India VIX falling by -20.06% to 12.63 indicates low market volatility and reduced options hedging pressure.
The NSE IPO subscription opened for public bidding on September 17, boosting overall market sentiment across capital market shares.
Financial & Regulatory Disclaimer
InvesTalks provides stock market analysis, equity research, and financial content strictly for educational and informational purposes only. We are not a SEBI-registered investment advisor or portfolio manager. Market investments are subject to market risks. Always perform your own research or consult a certified SEBI-registered financial advisor before making buy/sell decisions.
Admin
Equity Research & Financial AnalysisCurated by the InvesTalks financial analysis team. Dedicated to providing disciplined stock market insights, technical chart evaluations, and long-term investor education.
 Market News & Outlook


Login to comment.