
Index
- Introduction
- Executive Summary Scorecard: September 24, 2026
- Today's Nifty 50 Market Anatomy (Thursday, September 24, 2026)
- Macroeconomic Drivers & Global Catalysts
- Deep Multi-Indicator Technical Deconstruction
- Key Support & Resistance Level Grid for Friday, September 25, 2026
- Friday Market Predictions & Decision-Tree Scenarios (September 25, 2026)
- Actionable Strategy & Risk Management Guidelines
Nifty 50 Market Analysis Today (Sept 24: 23,063) & Friday Prediction: Key Levels & Indicators
 By Admin
|
Sep 24, 2026
|
1 min read
|
6
|
🤍
0
By Admin
|
Sep 24, 2026
|
1 min read
|
6
|
🤍
0
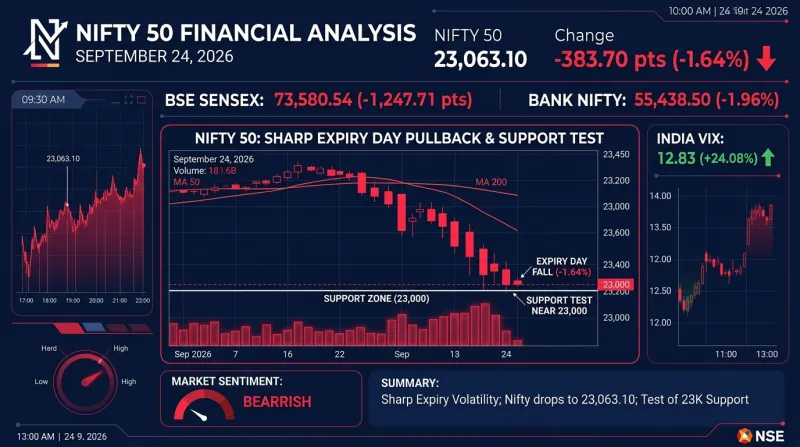
Indian equity benchmarks experienced an intense expiry day correction on Thursday, September 24, 2026, as Nifty 50 fell 383.70 points (-1.64%) to close at 23,063.10. The BSE Sensex dropped 1,247.71 points (-1.67%) to settle at 73,580.54, while the Nifty Bank index plunged 1,110.40 points (-1.96%) to 55,438.50, snapping recent momentum as heavy selling hit financial services, IT, and auto sectors.
This high-value editorial market analysis provides an authoritative breakdown of Thursday's trade. We examine the key primary drivers—including Brent crude oil prices spiking back to $105.40/barrel, US 10-Year Treasury yields climbing to 5.11%, and regulatory distribution concerns impacting financial heavyweights.
Heading into Friday, September 25, 2026, this article evaluates deep multi-indicator technical setups—including daily RSI dropping into extreme oversold territory (29.80), India VIX expanding +24.08% to 12.83, Option Chain Put-Call Ratio slipping to 0.55 (deep short-heavy setup), Central Pivot Range (CPR) width analysis, and a complete decision-tree scenario matrix to help traders and investors navigate Friday's session with strategic clarity.
Executive Summary Scorecard: September 24, 2026
| Market Metric / Index | Thursday Close (Sept 24, 2026) | Absolute Change | Percentage Change | Verified Technical & Market Observation |
|---|---|---|---|---|
| Nifty 50 Spot | 23,063.10 | -383.70 pts | -1.64% | Sharp expiry selloff; tested intraday low of 23,025.50 |
| BSE Sensex | 73,580.54 | -1,247.71 pts | -1.67% | Heavy unwinding in IT and Banking heavyweights |
| Nifty Bank | 55,438.50 | -1,110.40 pts | -1.96% | Breached 56,000 floor on distribution concerns |
| India VIX (Volatility Index) | 12.83 | +2.49 pts | +24.08% | Volatility spiked sharply during derivatives unwinding |
| FII Net Cash Flow (Sept 23) | +₹1,617.45 Cr | Net Buyers | Inflow | Previous session foreign institutional net buying |
| DII Net Cash Flow (Sept 23) | +₹2,341.46 Cr | Net Buyers | Inflow | Previous session domestic institutional net buying |
| Brent Crude Oil | $105.40 / bbl | Spiked +1.5% | Macro Friction | Crude price rebound weighed on emerging market equities |
Today's Nifty 50 Market Anatomy (Thursday, September 24, 2026)
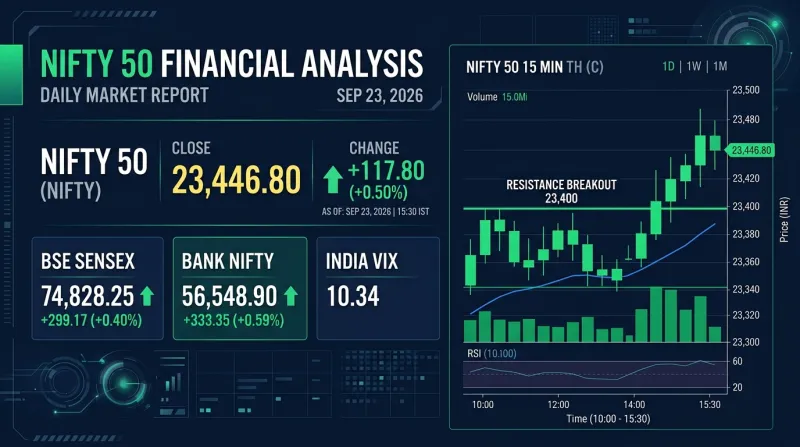
Indian benchmark equities suffered a sharp downside move on Thursday, September 24, 2026, as Nifty 50 dropped 383.70 points (-1.64%) to close at 23,063.10, down from Wednesday's close of 23,446.80. Opening at 23,425.10, Nifty touched a brief morning high of 23,450.40 before intense derivative unwinding pushed the index to an intraday low of 23,025.50.
The BSE Sensex experienced a steep decline, falling 1,247.71 points (-1.67%) to 73,580.54, while Nifty Bank dropped 1,110.40 points (-1.96%) to 55,438.50, driven by heavy selling across financial services, technology, and auto stocks.
Intraday Trajectory of Nifty 50 (Sept 24, 2026)23,450 +---------*------------------------------------+ High: 23,450.40| * (Open: 23,425) |23,300 | *** || ***** |23,150 | ********* ******* | Close: 23,063.10 (-383.7 pts)| ************ *** |23,025 +------------------------------*-----*---------+ Low: 23,025.509:15 AM 11:30 AM 1:45 PM 3:30 PM
Sectoral Performance Dynamics & Capital Rotation
- Laggards: Nifty Bank (-1.96%), Nifty Financial Services (-1.85%), Nifty IT (-1.40%), and Nifty Auto (-1.25%) bore the brunt of the expiry selloff.
- Defensives: Nifty Pharma (-0.35%) and select Healthcare names experienced relatively muted pullbacks compared to the broader market.
For real-time sectoral heatmaps and market breadth metrics, explore the InvesTalks Market Insights Hub.
Macroeconomic Drivers & Global Catalysts
Thursday's equity selloff was triggered by three prominent global and domestic macro drivers:
- Surge in US 10-Year Treasury Yields: The US 10-Year Treasury yield climbed to 5.11%, tightening global financial conditions and triggering capital outflow pressures across emerging markets.
- Rebound in Brent Crude ($105.40/bbl): Crude oil prices snapped their six-day decline, surging to $105.40/bbl on renewed Middle East supply fears and strengthening energy inflation concerns.
- Regulatory Distribution Concerns in Financials: Regulatory updates regarding insurance product distribution channels created temporary sentiment headwinds for private sector banks and insurance entities.
Stay informed on global macroeconomic trends via the InvesTalks Stock Market Blog.
Deep Multi-Indicator Technical Deconstruction
Our multi-indicator framework provides deep technical orientation for Friday, September 25, 2026:
1. Moving Average Hierarchy & 200-Day EMA Floor Retest
- 20-Day EMA (23,370) & 50-Day EMA (23,400): Thursday's breakdown pushed Nifty below both short-term averages, turning them into overhead dynamic resistance.
- 200-Day EMA (23,020–23,050 Zone): Nifty's intraday low of 23,025.50 retested the crucial 200-day Exponential Moving Average, where buyer defense historically emerges.
2. Relative Strength Index (RSI - 14 Days) Analysis
- Daily RSI plummeted from 54.20 down to 29.80, placing Nifty 50 in deep oversold territory (sub-30 level). In quantitative technical analysis, sub-30 RSI readings alongside a 200-EMA test generate a high-probability setup for an oversold short-covering relief bounce.
3. Central Pivot Range (CPR) for Friday, September 25
- Pivot Point (P): 23,179.67
- Bottom Central (BC): 23,237.95
- Top Central (TC): 23,121.39
- CPR Width: Wide CPR (~116.5 points).
TIP
Educational Insight on Wide CPR: A wide Central Pivot Range (over 100 points) reflects extreme price range expansion during the previous session. Following a high-volatility trend day down, a wide CPR setup generally favors base-building consolidation or mean-reversion trading between established support and resistance boundaries.
4. Option Chain Analysis & Put-Call Ratio (PCR)
- Put-Call Ratio (PCR): Dropped to 0.55, reflecting an extreme short-heavy option chain setup susceptible to sharp short-covering by call option writers.
- Call Open Interest (Resistance): Highest Call OI concentrated at 23,200 CE (1.40 crore shares) and 23,300 CE (1.65 crore shares).
- Put Open Interest (Support): Maximum Put OI positioned at 23,000 PE (1.80 crore shares) and 22,900 PE (1.20 crore shares).
        Nifty 50 Option Chain Open Interest Distribution

Call OI (Resistance)                   Put OI (Support)
[23,300 CE] █████████████████████████ 165L
[23,200 CE] ███████████████████ 140L
[23,100 CE] ████████ 65L
---------------------- [23,063 SPOT] ----------------------
                                       █████████████████████████████ 180L [23,000 PE]
                                       █████████████████ 120L [22,900 PE]
                                       ██████████ 75L [22,800 PE]
Analyze live option chain heatmaps and PCR shifts on the InvesTalks Nifty Option Chain Screener.
Key Support & Resistance Level Grid for Friday, September 25, 2026
| Level Type | Price Level (Pts) | Technical Justification & Market Context |
|---|---|---|
| Resistance 3 (R3) | 23,340 | 20-Day EMA Dynamic Resistance & High Overhead Wall |
| Resistance 2 (R2) | 23,250 | CPR Bottom Central Boundary & Pivot Resistance |
| Resistance 1 (R1) | 23,180 | Central Pivot Point (P) & Call Writing Ceiling |
| Pivot Point (P) | 23,179 | Daily Central Pivot Point |
| Support 1 (S1) | 23,000 | Major Psychological Floor & Maximum Put OI (1.8 Cr) |
| Support 2 (S2) | 22,920 | Multi-Month Swing Demand Zone |
| Support 3 (S3) | 22,850 | Major Structural Retracement Support |
Friday Market Predictions & Decision-Tree Scenarios (September 25, 2026)
Based on deep oversold RSI (29.80) and 200-day EMA support test, we outline three probabilistic trading scenarios for Friday, September 25, 2026:

Scenario A: Oversold Short-Covering Bounce (50% Probability)
- Trigger: A flat to positive opening allowing Nifty to trade above 23,060.
- Price Dynamics: Extremely low PCR (0.55) and oversold RSI (29.80) force intraday short-covering among call writers, pushing prices back toward the Central Pivot Point.
- Upside Targets: 23,180 (R1), extending toward 23,250 (R2).
Scenario B: Wide CPR Base Consolidation (35% Probability)
- Trigger: Flattish opening around 23,050 with option sellers defending 23,200 CE and 23,000 PE.
- Price Dynamics: The index consolidates within a wide range between 22,980 and 23,150 to absorb Thursday's volatility spike.
- Target Range: 23,020 – 23,120.
Scenario C: Bearish Breakdown Extension (15% Probability)
- Trigger: Continued surge in Brent crude oil above $107/bbl combined with aggressive foreign capital outflows.
- Price Dynamics: A decisive break below 23,000 (S1) invalidates the 200-day EMA floor support.
- Downside Targets: 22,920 (S2), extending to 22,850 (S3).
Explore advanced technical analysis tools on the InvesTalks Technical Analysis Portal.
Actionable Strategy & Risk Management Guidelines
For Options & Intraday Traders
- Bullish Setup: Look for long opportunities on a 15-minute candle closing above 23,100, targeting 23,180 and 23,240. Enforce a strict stop-loss below 23,010.
- Short Discipline: Avoid launching fresh aggressive short positions while RSI remains deeply oversold (<30) at the 23,000–23,020 200-day EMA floor. Initiate shorts only upon a confirmed breakdown below 22,980.
- Volatility Adjustment: With India VIX spiking +24.08% to 12.83, position sizes should be reduced to account for wider intraday price swings.
For Long-Term Investors
- RETESTS of the 200-day EMA zone (23,000–23,050) historically offer disciplined, high-probability entry windows for long-term equity accumulation. Phase capital systematically across fundamental large-cap market leaders.
❓ Frequently Asked Questions (FAQs)
An RSI reading below 30 indicates that the asset is in deep oversold territory. Technically, extreme oversold RSI levels combined with major moving average support (200-day EMA) frequently precede mean-reversion short-covering bounces.
A PCR of 0.55 reflects a heavily short-biased option chain setup. When PCR drops below 0.60, call option writers face short-squeeze risks if favorable news or buying signals push prices above immediate resistance levels.
Nifty 50 closed at 23,063.10, declining 383.70 points (-1.64%), after reaching an intraday low of 23,025.50.
The BSE Sensex closed at 73,580.54, falling 1,247.71 points (-1.67%).
Rising US Treasury yields increase global risk-free interest rates, triggering capital outflows from emerging market equities like India back into US dollar-denominated fixed-income assets.
Key support levels stand at S1: 23,000, S2: 22,920, and S3: 22,850. Primary resistance levels are R1: 23,180, R2: 23,250, and R3: 23,340.
Financial & Regulatory Disclaimer
InvesTalks provides stock market analysis, equity research, and financial content strictly for educational and informational purposes only. We are not a SEBI-registered investment advisor or portfolio manager. Market investments are subject to market risks. Always perform your own research or consult a certified SEBI-registered financial advisor before making buy/sell decisions.
Admin
Equity Research & Financial AnalysisCurated by the InvesTalks financial analysis team. Dedicated to providing disciplined stock market insights, technical chart evaluations, and long-term investor education.
 Market News & Outlook
Login to comment.