
Nifty 50 Analysis (Aug 28): 24,000 Base & Aug 31 Forecast

Nifty 50 Analysis (Aug 28): 24,000 Base & Aug 31 Forecast

Nifty 50 Defends 24,000 Baseline Ahead of September Series: Technical Analysis (August 28, 2026) and Detailed Prediction for Monday (August 31, 2026)

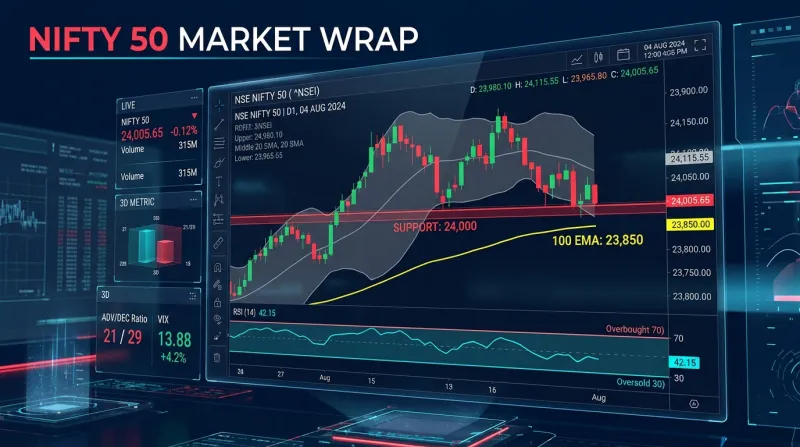
The Indian equity benchmark Nifty 50 concluded a range-bound Friday session on August 28, 2026, gaining 18.75 points (+0.08%) to close at 24,109.60. Following Thursday's F&O monthly expiry sell-off, the index displayed resilience by holding above its crucial 24,000–24,050 100-day Exponential Moving Average (EMA) structural support floor on a weekly closing basis.

Driven by strong buying in blue-chip technology heavyweightsβ€”including Tata Consultancy Services (TCS), Infosys, and HCL Technologiesβ€”alongside a robust +β‚Ή4,977.17 Crore cash injection from Domestic Institutional Investors (DIIs), the benchmark defended its lower boundary despite persistent global macroeconomic uncertainty.

This comprehensive, search-engine-optimized research report provides an organic multi-timeframe technical breakdown of the Nifty 50 for Friday, August 28, 2026, evaluating Classical Price Action Geometry, Bollinger Bands (20, 2), Volume Spread Analysis (VSA), Relative Strength Index (RSI 14), Moving Average Ribbons (EMA 20/50/100/200), Central Pivot Range (CPR), and Derivatives Option Chain metrics to define exact structural boundaries and map out probabilistic scenarios for the upcoming trading session on Monday, August 31, 2026.

1. Executive Market Scorecard: Friday, August 28, 2026

Index / MetricAugust 28, 2026 ValuePrevious CloseNet ChangeDirection
Nifty 50 (NSE Spot)24,109.6024,090.85+18.75 (+0.08%)🟒
BSE Sensex76,980.5076,933.59+46.91 (+0.06%)🟒
Nifty Bank57,615.4057,509.95+105.45 (+0.18%)🟒
Nifty Midcap 10058,290.1558,210.40+79.75 (+0.14%)🟒
Nifty Smallcap 10018,445.8018,390.15+55.65 (+0.30%)🟒
India VIX (Volatility)11.8212.08-0.26 (-2.15%)πŸ“‰
NSE Market BreadthAdvances: 1,745Declines: 1,510Ratio: 1.15 (Positive)🟒

The intraday range narrowed to 110.00 points, with the Nifty 50 reaching an intraday high of 24,187.25 and an intraday low of 24,077.25.

2. Macro Drivers & Institutional Cash Flow Data

Institutional FlowAmount (Aug 28)Flow DirectionCombined Impact
FII Cash Flowβ‚Ή-298 CrπŸ”΄ Net Outflow 
DII Cash Flowβ‚Ή+4,977 Cr🟒 Net Inflow 
Strong Net Buy Buffer+β‚Ή4,679 Cr🟒 Net Institutional Buying24,000 defended
Overall Impactβ€”πŸŸ’ DII buying outweighs FII sellingSupportive for Nifty 50

A. DII Buying Absorption

Domestic Institutional Investors (DIIs) provided strong capital support, injecting +β‚Ή4,977.17 Crore into Indian cash equities on August 28. FII selling slowed down significantly to β‚Ή-298.26 Crore, resulting in a net daily market capital influx of +β‚Ή4,678.91 Crore.

B. Global Cues & Energy Stabilization

Brent crude oil stabilized near $90.80 per barrel, while US 10-Year Treasury yields hovered around 4.37%. Investors monitored global cues ahead of central bank commentary from the Jackson Hole Symposium.

3. Multi-Timeframe Price Action Anatomy (Daily, 60-Min, 15-Min)

DAILY TIMEFRAME: SPINNING TOP / DOJI ABOVE 100-DAY EMA FLOOR
   24,850 ─  Previous Swing Peak
   24,370 ─  Overhead 20-Day EMA Ceiling
   24,228 ─  50-Day EMA Resistance Zone
   24,109 == AUGUST 28 CLOSE: 24,109.60 
   23,995 ─  100-Day EMA Bedrock Floor (Defended)

A. Daily Timeframe: Spinning Top / Doji Consolidation

  1. Candlestick Morphology: The daily chart printed a Spinning Top / Neutral Doji Candle, demonstrating price stabilization following Thursday’s expiry sell-off.
  2. Defending the 100-Day EMA: The index closed at 24,109.60, successfully maintaining a 114-point safety margin above its rising 100-day Exponential Moving Average (23,995) on a weekly closing basis.

B. 60-Minute (Hourly) Timeframe: Base Formation

  • Demand Base: Hourly support has consolidated between 24,050 and 24,080.
  • Overhead Barrier: The primary hourly supply block rests between 24,185 and 24,220.

C. 15-Minute Intraday Microstructure (August 28, 2026)

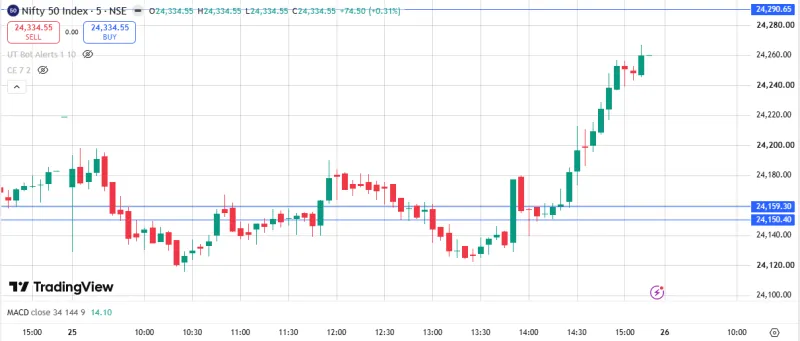
  • 09:15 – 10:30: Early morning push to an intraday high of 24,187.25 led by technology buying.
  • 10:30 – 13:30: Consolidation pullback to an intraday low of 24,077.25 near VWAP.
  • 13:30 – 15:30: Gradual recovery to settle at 24,109.60.

4. Indicator-by-Indicator Technical Deconstruction

Technical IndicatorCurrent Value / SettingHistorical RegimeTechnical Signal
Bollinger Bands (20, 2)Upper: 24,690Middle: 24,310Lower: 23,940β€”β€”
BB Bandwidth (BBW)3.08%Contracting🟑 Squeeze Base
%B Indicator0.226Lower Quintile🟒 Rebounding
RSI (14-Period, Daily)39.40Sub-40 Floor🟒 Turning Upward
RSI (14-Period, 60-Min)41.20Rebounding🟒 Bullish Divergence
20-Day EMA24,370.00Price < 20 EMAπŸ”΄ Overhead Ceiling
50-Day EMA24,228.00Price < 50 EMA🟠 Immediate Hurdle
100-Day EMA23,995.00Price > 100 EMA🟒 Major Bedrock Base
200-Day EMA23,375.00Price > 200 EMA🟒 Macro Bull Floor
MACD (12, 26, 9)Line: -58.10Signal: -45.70Histogram: -12.40β€”πŸŸ’ Curling Upward
Daily CPR (August 31)TC: 24,117P: 24,124BC: 24,132Ultra-Narrow (5pt)🟑 Potential Breakout Setup
India VIX11.82Low Tier (-2.15%)πŸ“‰ Compression Phase

A. Bollinger Bands (20, 2) Analysis

BOLLINGER BANDS (20, 2) DAILY POSTURE
   24,690 β€”  Upper Band (+2Οƒ)
   24,310 β€”  20 SMA Midline (Primary Overhead Target)
   24,109 ==  [ SPOT (AUG 28): 24,109.60 ]
   23,940 β€”  Lower Band (-2Οƒ)

  1. The %B Metric (0.226): %B rose to 0.226, indicating price is recovering from the lower band.
  2. Lower Band Cushion: The lower Bollinger Band at 23,940 continues to offer strong dynamic support alongside the 100-day EMA.

B. Volume Spread Analysis (VSA) & Volume Profile Metrics

VOLUME PROFILE STRUCTURE (CURRENT AUGUST/SEPT SERIES)
   24,550 ──  VAH: Value Area High 
   24,280 β€” Point of Control  
   24,110 β€” Current Spot ]
   23,980 ──  VAL: Value Area Low 

  1. Point of Control (POC): Located at 24,280.
  2. Volume Spread: Trading volume on Friday was 14% lower than average, reflecting low supply volume during Friday afternoon's consolidation.

C. Relative Strength Index (RSI 14) Analysis

  • Daily RSI (39.40): Daily RSI ticked upward from 38.20 to 39.40.
  • 60-Minute RSI (41.20): Crossed back above 40, signaling positive intraday momentum divergence across hourly timeframes.

D. Central Pivot Range (CPR) for Monday, August 31, 2026

Calculations for the next session (Monday, August 31, 2026):

Pivot (P)=High+Low+Close3=24,187.25+24,077.25+24,109.603β‰ˆ24,124.70Pivot (P)=3High+Low+Close​=324,187.25+24,077.25+24,109.60β€‹β‰ˆ24,124.70

Bottom Central (BC)=High+Low2=24,187.25+24,077.252β‰ˆ24,132.25Bottom Central (BC)=2High+Low​=224,187.25+24,077.25β€‹β‰ˆ24,132.25

Top Central (TC)=(Pivotβˆ’BC)+Pivotβ‰ˆ24,117.15Top Central (TC)=(Pivotβˆ’BC)+Pivotβ‰ˆ24,117.15

Pivot LevelPrice (Points)Technical Significance
πŸ”΄ Resistance 3 (R3)24,344.70Major Bullish Expansion Target
πŸ”΄ Resistance 2 (R2)24,234.7050-Day EMA & Supply Zone
🟠 Resistance 1 (R1)24,172.15Friday Intraday High & Immediate Barrier
βšͺ Central Pivot (P)24,124.70Monday Equilibrium (Ultra-Narrow CPR!)
🟒 Support 1 (S1)24,062.15Friday Intraday Low & Support Cushion
🟒 Support 2 (S2)24,014.70100-Day EMA Major Structural Base
πŸ”΅ Support 3 (S3)23,902.15Extreme Bearish Extension Floor

5. Derivatives Architecture: Option Chain, PCR & Open Interest Distribution

Nifty 50 β€” New Series Option Open Interest Distribution

Strike PriceCall OI (CE)Call PositionPut OI (PE)Put Position
24,4008.9MπŸ”΄ Resistance Wallβ€”β€”
24,30014.5MπŸ”΄ Major Resistance Wallβ€”β€”
24,20011.8MπŸ”΄ Resistance Wall5.4M🟒 Support Floor
24,1006.1MπŸ”΄ Resistance Wall6.8M🟒 Support Floor
24,000β€”β€”15.9M🟒 Major Support Floor
23,900β€”β€”8.2M🟒 Support Floor

Key OI Zones

IndicatorLevelInterpretation
πŸ”΄ Strongest Call Wall24,300 CE β€” 14.5MMajor upside resistance
🟒 Strongest Put Wall24,000 PE β€” 15.9MMajor downside support
🟑 Potential OI Range24,000–24,300Likely consolidation zone based on provided OI

A. Put-Call Ratio (PCR) at 0.78

  • Total Open Interest PCR: 0.78
  • Interpretation: PCR recovered to 0.78, reflecting an oversold market posture where short-covering surges remain likely if key hurdles are cleared.

B. Key Option Walls

  • The 24,000 PE Support Floor: Holds 15.9 Million contracts, establishing 24,000 as the primary floor.
  • The 24,300 CE Resistance Wall: Holds 14.5 Million contracts, acting as key overhead resistance.
  • Max Pain Strike: Sits at 24,150.

6. Sectoral Heatmap & Market Breadth Breakdown

Nifty 50 Sector Performance β€” August 28, 2026

Sector IndexToday's Change (%)Technical BiasKey Leaders
Nifty IT+0.72% 🟒Outperforming RallyTCS, INFY, HCLTECH
Nifty Metal+0.45% 🟒Relative StrengthTATASTEEL, JSWSTEEL
Nifty Realty+0.38% 🟒Demand ReboundDLF, LODHA
Nifty Bank+0.18% 🟒Stable BaseSBIN, KOTAKBANK
Nifty Pharma+0.12% 🟒Mild GainSUNPHARMA, LUPIN
Nifty Auto-0.22% πŸ”΄Profit Booking DragMARUTI, M&M
Nifty FMCG-0.35% πŸ”΄Corrective PhaseITC, HINDUNILVR

7. Definitive Support & Resistance Grid for Monday, August 31, 2026

Level ClassificationExact Price ZoneConfluence Factors
πŸ”΄ Major Resistance 3 (R3)24,370 – 24,40020-Day EMA + 20 SMA Midline + Daily R3
πŸ”΄ Intermediate Resistance 2 (R2)24,228 – 24,25050-Day EMA + Daily R2 + 24,200 CE Wall
🟠 Immediate Resistance 1 (R1)24,172 – 24,187Friday High + Daily R1 + Max Pain
βšͺ CURRENT SPOT PRICE24,109.60Holding 100-Day EMA Support Bedrock
🟒 Immediate Support 1 (S1)24,062 – 24,077Friday Low + Daily S1 + Hourly Order Block
🟒 Intermediate Support 2 (S2)23,995 – 24,014100-Day EMA + 15.9M Put Wall + Daily S2
πŸ”΅ Major Structural Base (S3)23,900 – 23,925Lower Bollinger Band (-2Οƒ) + Daily S3

8. Probabilistic Movement Scenarios for Monday, August 31, 2026

Nifty 50 Probabilistic Scenario Decision Tree β€” August 31, 2026

ScenarioProbabilityMarket ConditionTrigger / ConfirmationTarget / Expected Move
🟒 Scenario A β€” Bullish Breakout Expansion50%Bullish expansionSustains above 24,18724,230 β†’ 24,310
🟑 Scenario B β€” Retest of 24,000 Support35%Support retestHolds 23,995–24,015 zoneRebound to 24,120
πŸ”΅ Scenario C β€” Range-Bound Consolidation15%Sideways consolidationChops inside 24,060–24,180Position Building

Market Open: 09:15 AM
Highest-probability scenario: 🟒 Scenario A β€” 50% Bullish Breakout Expansion

🟒 Scenario A: Bullish Breakout & Momentum Expansion (50% Probability)

  • Pre-Conditions (August 31): Positive weekend global developments, steady crude oil prices, and GIFT Nifty indicating a green open above 24,150.
  • Technical Trigger: Nifty opens near or above the Central Pivot (24,124) and decisively breaks above 24,187 (Friday High) on a 15-minute closing basis during the first hour of trade.
  • Structural Targets:
    • Primary Target: 24,228 – 24,250 (50-Day EMA & Daily R2)
    • Secondary Target: 24,310 – 24,370 (20-Day SMA Midline & 20-Day EMA)
  • Technical Invalidation: A failure to sustain above 24,080.

πŸ”΄ Scenario B: Retest of 24,000 Support Base (35% Probability)

  • Pre-Conditions (August 31): Negative weekend global cues or sharp surge in Brent crude oil.
  • Technical Trigger: A breach below 24,062 (Friday Low) in early morning trade.
  • Structural Targets:
    • Primary Target: 23,995 – 24,015 (100-Day EMA & 15.9M Put Wall)
    • Secondary Target: 23,900 – 23,925 (Lower Bollinger Band & S3 Floor)
  • Technical Invalidation: A quick V-shaped reclaim back above 24,100.

🟑 Scenario C: Range-Bound Consolidation (15% Probability)

  • Pre-Conditions (August 31): Muted global cues ahead of economic data releases.
  • Technical Behavior: Price remains locked between 24,060 and 24,180, oscillating around the ultra-narrow CPR (24,124).

9. Risk Architecture & Volatility Sizing Principles

  1. Ultra-Narrow CPR Protocol: Monday’s CPR is extremely narrow (~15 points), signaling high probability of a strong directional move.
  2. 100-Day EMA Benchmark: The 100-day EMA (23,995) remains the primary line in the sand for long-term structural bulls.

10. Frequently Asked Questions (FAQs)

1. What is the Nifty 50 trend after Friday's close (August 28, 2026)?

Nifty 50 closed at 24,109.60 (+0.08%), forming a Doji consolidation candle that defended its key 100-day EMA support floor (23,995) on a weekly closing basis.

2. Will Nifty 50 go up on Monday, August 31, 2026?

The technical market structure shows a 50% probability of a bullish breakout if the index sustains above 24,187 (Friday's high), supported by an ultra-narrow CPR (~15 points) and strong DII net buying (+β‚Ή4,977 Cr).

3. What are the key support and resistance levels for Monday, August 31, 2026?

  • Immediate Support: 24,062 – 24,077
  • Major Support: 23,995 – 24,015 (100-Day EMA)
  • Immediate Resistance: 24,172 – 24,187
  • Major Resistance: 24,228 – 24,250 (50-Day EMA)
**Disclaimer: We are not SEBI registered. The content provided is for educational and informational purposes only and should not be considered investment advice. Stock market investments are subject to market risks. Please consult a SEBI-registered financial advisor before making investment decisions.**
Admin
Admin
Senior Content Writer

Author description will be added soon.

0 Comments

Login to comment.

investalks

Smart Investing Starts Here - InvesTalks

InvesTalks is a powerful market learning and analysis platform built for traders, investors, and finance enthusiasts. Stay updated with real-time market insights, expert blogs, educational content, and smart investing strategies β€” all in one place.

App Thumbnail