
Index
- Introduction
- 1. Executive Market Summary: Thursday, August 27, 2026 Scorecard
- 2. Macro Catalysts & Institutional Flow Dynamics
- 3. Multi-Timeframe Price Action Anatomy (Daily, 60-Min, 15-Min)
- 4. Indicator-by-Indicator Technical Deconstruction
- 5. Derivatives Architecture: Option Chain, PCR & Open Interest Distribution
- 6. Sectoral Heatmap & Market Breadth Breakdown
- 7. Definitive Support & Resistance Grid for Friday, August 28, 2026
- 8. Probabilistic Movement Scenarios for Friday, August 28, 2026
- 9. Risk Architecture & Volatility Sizing Principles
- 10. Frequently Asked Questions (FAQs)
Nifty 50 Erases Early Gains on Monthly Expiry Volatility
 By Admin
|
Aug 27, 2026
|
1 min read
|
300
|
🤍
0
By Admin
|
Aug 27, 2026
|
1 min read
|
300
|
🤍
0
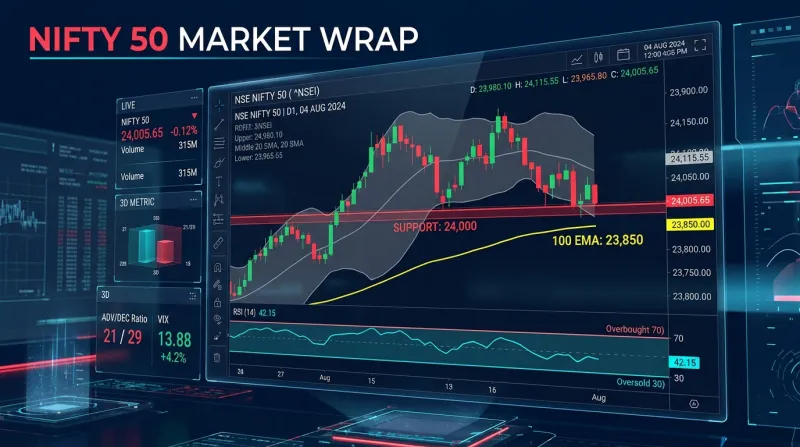
The Indian equity benchmark Nifty 50 navigated a volatile monthly F&O expiry session on Thursday, August 27, 2026, opening higher but succumbing to persistent late-afternoon selling pressure to close down 116.90 points (-0.48%) at 24,090.85.
After opening on a positive note at 24,277.60 and scaling an intraday high of 24,285.50, the index failed to sustain above its 50-day Exponential Moving Average (24,228). A wave of profit booking—amplified by the monthly derivatives rollover and the introduction of the new Closing Auction Session (CAS) mechanics—pushed the benchmark down by over 220 points from its intraday high to record a low of 24,065.20 before stabilizing into the close.
While defensive counters in Pharma (+0.42%), Healthcare (+0.35%), and Consumer Durables (+0.28%) offered resilience, heavy distribution across PSU Banks (-0.98%), Metals (-0.85%), and FMCG (-0.72%) dragged market breadth into negative territory (1,341 advances vs. 2,160 declines).
This comprehensive technical research report provides a multi-timeframe examination of the Nifty 50 for Thursday, August 27, 2026, evaluating Classical Price Action Geometry, Bollinger Bands (20, 2), Volume Spread Analysis (VSA), Relative Strength Index (RSI 14), Moving Average Ribbons (EMA 20/50/100/200), Central Pivot Range (CPR), and Derivatives Option Chain metrics to define exact structural boundaries and map out probabilistic movement scenarios for Friday, August 28, 2026.
1. Executive Market Summary: Thursday, August 27, 2026 Scorecard
| Index / Metric | August 27, 2026 Value | Previous Close | Net Change | Direction |
|---|---|---|---|---|
| Nifty 50 (NSE Spot) | 24,090.85 | 24,207.75 | -116.90 (-0.48%) | 🔴 |
| BSE Sensex | 76,933.59 | 77,472.94 | -539.35 (-0.70%) | 🔴 |
| Nifty Bank | 57,509.95 | 57,783.75 | -273.80 (-0.47%) | 🔴 |
| Nifty Midcap 100 | 58,210.40 | 58,450.15 | -239.75 (-0.41%) | 🔴 |
| Nifty Smallcap 100 | 18,390.15 | 18,480.60 | -90.45 (-0.49%) | 🔴 |
| India VIX | 12.08 | 11.62 | +0.46 (+3.96%) | 📈 |
| NSE Market Breadth | Advances: 1,341 | Declines: 2,160 | Ratio: 0.62 (Weak) | 🔴 |
The intraday swing expanded to 220.30 points, reflecting intense monthly expiry positioning between short sellers pressing supply at 24,280 and buyers defending the 24,000–24,050 structural demand floor.
2. Macro Catalysts & Institutional Flow Dynamics
INSTITUTIONAL LIQUIDITY TRANSMISSION
[ FII Cash Flow (Aug 26): +₹502 Cr ] ───┐
├───► [ Strong DII Absorption Base ] ───► [ 24,000 Floor Intact ]
[ DII Cash Flow (Aug 26): +₹6,425 Cr ] ───┘
A. DII Liquidity Shield
Institutional data leading into today’s session highlighted massive domestic accumulation. On August 26, Domestic Institutional Investors (DIIs) deployed a net +₹6,425.16 Crore in cash equities, providing a deep liquidity foundation that prevented a sharp breach below the 24,000 baseline.
B. Global Cues & Energy Prices
While global markets digested earnings from U.S. tech giants, domestic sentiment was capped by Brent crude oil holding near $91.50 per barrel and US 10-Year Treasury yields remaining elevated at 4.38%.
3. Multi-Timeframe Price Action Anatomy (Daily, 60-Min, 15-Min)
DAILY TIMEFRAME: TESTING THE CRUCIAL 100-DAY EMA BEDROCK
24,850 ── (Previous Major Peak)
24,360 ── (Lower High 3)
24,285 ── (Today's Intraday High)
24,090 == [ AUGUST 27 CLOSE: 24,090.85 ]
23,995 ── 100-Day EMA Bedrock Floor
A. Daily Timeframe: Rejection at 50 EMA & Test of 100 EMA
- Candlestick Structure: Thursday's candle printed a Bearish Rejection Bar with an upper shadow. The price opened at 24,277, probed 24,285, but failed to sustain above the 50-day EMA (24,228), drifting back toward the lower end of its weekly trading range.
- The 100-Day EMA Baseline: The Nifty 50 closed just 95 points above its ascending 100-day Exponential Moving Average (23,995). In technical history, the 100-day EMA has consistently served as an institutional accumulation zone throughout 2026.
B. 60-Minute (Hourly) Timeframe: Value Area Slippage
- Hourly Rejection: The 60-minute chart formed a lower-high rejection pattern at 24,285, re-establishing short-term hourly supply between 24,220 and 24,280.
- Immediate Demand Block: Hourly support rests in the 24,020–24,060 corridor.
C. 15-Minute Intraday Microstructure (August 27, 2026)
- 09:15 – 10:30: Early push from 24,277 to intraday high of 24,285.50.
- 10:30 – 14:00: Steady downward drift below VWAP (24,180) driven by F&O rollover unwinding.
- 14:00 – 15:30: Accelerated selling down to 24,065.20 before a modest closing auction bounce to 24,090.85.
4. Indicator-by-Indicator Technical Deconstruction
| Technical Indicator | Current Value / Setting | Historical Regime | Technical Signal |
|---|---|---|---|
| Bollinger Bands (20, 2) | Upper: 24,710Middle: 24,310Lower: 23,940 | — | — |
| BB Bandwidth (BBW) | 3.16% | Band Expansion | 🟡 Volatility Test |
| %B Indicator | 0.185 | Lower Band Zone (<0.20) | 🟡 Near Oversold |
| RSI (14-Period, Daily) | 38.20 | Sub-40 Weakness | 🟡 Oversold Approach |
| RSI (14-Period, 60-Min) | 34.10 | Approaching Oversold | 🟢 Bullish Divergence |
| 20-Day EMA | 24,375.00 | Price < 20 EMA | 🔴 Overhead Supply |
| 50-Day EMA | 24,228.00 | Price < 50 EMA | 🔴 Immediate Ceiling |
| 100-Day EMA | 23,995.00 | Price > 100 EMA | 🟢 Major Support |
| 200-Day EMA | 23,370.00 | Price > 200 EMA | 🟢 Macro Trend Floor |
| MACD (12, 26, 9) | Line: -62.10Signal: -48.00Histogram: -14.10 | — | 🔴 Neutral-Bearish |
| Daily CPR (August 28) | TC: 24,175P: 24,147BC: 24,119 | Moderately Wide | 🟡 Moderate Range |
| India VIX | 12.08 | Low-to-Moderate Tier | 📈 Tick Up (+3.96%) |
A. Bollinger Bands (20, 2) Analysis
BOLLINGER BANDS (20, 2) DAILY POSTURE
24,710 – Upper Band (+2σ)
24,310 – 20 SMA Midline (Overhead Dynamic Ceiling)
24,090 = [ SPOT (AUG 27): 24,090.85 ]
23,940 – Lower Band (-2σ)
- The %B Metric (0.185): At 0.185, the %B indicator reflects that price is once again probing the bottom 20th percentile of its 20-day statistical channel.
- Lower Band Proximity: The Lower Bollinger Band sits at 23,940, coinciding with the major 100-day EMA support corridor (23,980–24,000).
B. Volume Spread Analysis (VSA) & Volume Profile Metrics
VOLUME PROFILE STRUCTURE (AUGUST 2026 RANGE)
24,550 ──── [ VAH: Value Area High ]
24,310 ▓▓▓▓ [ High Volume Node / 20 SMA ]
24,250 ▓▓▓▓ [ Point of Control ]
24,090 ▓▓▓▓ [ Current Spot ]
23,980 ──── [ VAL: Value Area Low ]
- Point of Control (POC): Sits at 24,250. Trading below the POC keeps short-term price discovery in a corrective state.
- Value Area Low (VAL): Aligns at 23,980.
C. Relative Strength Index (RSI 14) Analysis
- Daily RSI (38.20): Daily RSI dipped back to 38.20. Readings below 40 historically indicate oversold conditions where risk-reward favors buyers over short-sellers.
- 60-Minute RSI (34.10): Near the oversold 30 threshold, displaying mild positive divergence on lower timeframes.
D. Exponential Moving Average (EMA) Ribbon Alignment
- 50-Day EMA (24,228): Re-established as immediate resistance.
- 100-Day EMA (23,995): Serves as the primary structural demand floor for tomorrow (Friday, August 28, 2026).
E. Central Pivot Range (CPR) & Daily Pivots for Friday, August 28, 2026
Calculations for Friday's session (August 28, 2026):
Pivot (P)=High+Low+Close3=24,285.50+24,065.20+24,090.853≈24,147.18Pivot (P)=3High+Low+Close=324,285.50+24,065.20+24,090.85≈24,147.18
Bottom Central (BC)=High+Low2=24,285.50+24,065.202≈24,175.35Bottom Central (BC)=2High+Low=224,285.50+24,065.20≈24,175.35
Top Central (TC)=(Pivot−BC)+Pivot≈24,119.01Top Central (TC)=(Pivot−BC)+Pivot≈24,119.01
| Pivot Level | Price (Points) | Technical Significance |
|---|---|---|
| 🔴 Resistance 3 (R3) | 24,475.40 | Major Bullish Rebound Target |
| 🔴 Resistance 2 (R2) | 24,367.48 | 20-Day EMA / Supply Zone |
| 🟠 Resistance 1 (R1) | 24,229.16 | 50-Day EMA & Immediate Barrier |
| ⚪ Central Pivot (P) | 24,147.18 | Friday Session Equilibrium |
| 🟢 Support 1 (S1) | 24,008.86 | Today's Low & 24,000 Support Cushion |
| 🟢 Support 2 (S2) | 23,926.86 | 100-Day EMA Breach / Lower Band (-2σ) |
| 🔵 Support 3 (S3) | 23,788.54 | Extreme Bearish Extension Level |
5. Derivatives Architecture: Option Chain, PCR & Open Interest Distribution
| Strike Price | Call OI (CE) | Call Position | Put OI (PE) | Put Position |
|---|---|---|---|---|
| 24,400 | 9.8M | 🔴 Resistance Wall | — | — |
| 24,300 | 12.5M | 🔴 Resistance Wall | — | — |
| 24,200 | 14.8M | 🔴 Major Resistance Wall | 4.8M | 🟢 Support Floor |
| 24,100 | 7.2M | 🔴 Resistance Wall | 6.5M | 🟢 Support Floor |
| 24,000 | — | — | 16.2M | 🟢 Major Support Floor |
| 23,900 | — | — | 8.5M | 🟢 Support Floor |
Key OI Zones:
- 🔴 Strongest Call Wall: 24,200 CE — 14.8M
- 🟢 Strongest Put Wall: 24,000 PE — 16.2M
- 🟡 Potential range indicated by OI: 24,000–24,200
A. Put-Call Ratio (PCR) at 0.72 (Deep Oversold)
- Current Total OI PCR: 0.72
- Interpretation: Following monthly expiry unwinding, the PCR dropped to 0.72. In quantitative history, PCR readings in the 0.65–0.75 zone reflect a crowded call-side consensus, frequently triggering short-covering rebounds on Friday sessions.
B. Open Interest Walls
- The 24,000 Put Fortress: Holds 16.2 Million contracts, establishing 24,000 as the ultimate line of defense for option sellers.
- The 24,200 Call Ceiling: Holds 14.8 Million contracts, serving as immediate overhead resistance.
- Max Pain Strike: Sits at 24,150.
6. Sectoral Heatmap & Market Breadth Breakdown
| Sector Index | Today's Change (%) | Technical Bias | Key Stocks |
|---|---|---|---|
| Nifty Pharma | +0.42% 🟢 | Defensive Holding | SUNPHARMA, LUPIN |
| Nifty Healthcare | +0.35% 🟢 | Relative Outperformer | MAXHEALTH, APOLLO |
| Nifty Consumer Durables | +0.28% 🟢 | Mild Buying | TITAN, DIXON |
| Nifty IT | -0.15% 🔴 | Neutral Consolidation | INFY, HCLTECH |
| Nifty Auto | -0.45% 🔴 | Corrective Drag | M&M, MARUTI |
| Nifty Bank | -0.47% 🔴 | Underpressure | HDFCBANK, ICICIBANK |
| Nifty FMCG | -0.72% 🔴 | Profit Booking | ITC, NESTLEIND |
| Nifty Metal | -0.85% 🔴 | Global Commodity Lag | HINDALCO, TATASTEEL |
| Nifty PSU Bank | -0.98% 🔴 | Top Laggard | SBIN, BANKBARODA |
7. Definitive Support & Resistance Grid for Friday, August 28, 2026
| Level Classification | Exact Price Zone | Confluence Factors |
|---|---|---|
| 🔴 Major Resistance 3 (R3) | 24,360 – 24,390 | 20-Day EMA + 20 SMA Midline + Daily R2 |
| 🔴 Intermediate Resistance 2 (R2) | 24,225 – 24,250 | 50-Day EMA + Pivot R1 + 24,200 CE Wall |
| 🟠 Immediate Resistance 1 (R1) | 24,145 – 24,175 | Daily Central Pivot (P) + Max Pain Strike |
| ⚪ CURRENT SPOT PRICE | 24,090.85 | Testing 24,000–24,100 Support Zone |
| 🟢 Immediate Support 1 (S1) | 24,000 – 24,025 | 100-Day EMA + 16.2M Put Open Interest Wall |
| 🟢 Intermediate Support 2 (S2) | 23,925 – 23,950 | Lower Bollinger Band (-2σ) + Daily S2 |
| 🔵 Major Structural Base (S3) | 23,850 – 23,880 | Macro 0.618 Fibonacci Retracement Level |
8. Probabilistic Movement Scenarios for Friday, August 28, 2026
| Scenario | Probability | Market Condition | Trigger / Confirmation | Target / Expected Move |
|---|---|---|---|---|
| 🟢 Scenario A — Bullish Relief Rebound | 50% | Relief rebound | Reclaims 24,150 with volume | 24,230 → 24,310 |
| 🔴 Scenario B — Bearish Breakdown | 35% | Bearish continuation | Breaks below 23,980 | 23,920 → 23,850 |
| 🟡 Scenario C — Range-Bound Consolidation | 15% | Sideways consolidation | Chops inside 24,020–24,160 | Position Adjustments |
🟢 Scenario A: Short-Covering Relief Rebound (50% Probability)
- Pre-Conditions (August 28): Muted crude oil prices, stable overnight U.S. markets, and GIFT Nifty indicating a flat-to-green open above 24,120.
- Technical Trigger: Nifty opens above 24,100 and breaks above 24,150 (Central Pivot) within the first hour of trade on expanding volume.
- Structural Targets:
- Primary Target: 24,230 (50-Day EMA and R1 Pivot)
- Secondary Extension: 24,310 – 24,350 (20-Day SMA Midline & Point of Control)
- Technical Invalidation: A breakdown below 24,000.
🔴 Scenario B: Structural Breakdown Below 23,980 (35% Probability)
- Pre-Conditions (August 28): Fresh geopolitical escalations, crude oil surging past $93, or aggressive morning Call writing at 24,100 CE.
- Technical Trigger: A sustained 15-minute candle close below 23,980 (100-Day EMA).
- Structural Targets:
- Primary Target: 23,925 (Lower Bollinger Band & S2 Pivot)
- Secondary Extension: 23,850 (Major Fibonacci Support Base)
- Technical Invalidation: A quick V-shaped reclaim back above 24,050.
🟡 Scenario C: Range-Bound Consolidation (15% Probability)
- Pre-Conditions (August 28): Muted global cues ahead of weekend economic commentary.
- Technical Behavior: Price remains locked between 24,020 and 24,160, consolidating near the 100-day EMA floor.
9. Risk Architecture & Volatility Sizing Principles
- The 100-Day EMA Defense: The 100-day EMA (23,995) is the primary trend-defining benchmark on the daily timeframe; managing risk around this boundary is essential for capital preservation.
- PCR Reversal Gauge: With PCR at 0.72, risk-reward favors defensive accumulation over aggressive shorting at lower boundaries.
10. Frequently Asked Questions (FAQs)
1. Why did the Nifty 50 drop today (Thursday, August 27, 2026)?
The Nifty 50 fell 116.90 points due to monthly F&O expiry volatility, profit-booking following the introduction of Closing Auction Session (CAS) mechanics, high Brent crude prices ($91.50/bbl), and selling in PSU Banks and Metal stocks.
2. Is the 24,000 level a strong support for Friday, August 28, 2026?
Yes. The 24,000 level is supported by the rising 100-day EMA (23,995), the lower rail of the channel, and 16.2 Million Put Open Interest contracts.
3. What are the key support and resistance levels for Friday, August 28, 2026?
- Immediate Support: 24,000 – 24,025
- Major Support: 23,925 – 23,950
- Immediate Resistance: 24,145 – 24,175
- Major Resistance: 24,225 – 24,250
Financial & Regulatory Disclaimer
InvesTalks provides stock market analysis, equity research, and financial content strictly for educational and informational purposes only. We are not a SEBI-registered investment advisor or portfolio manager. Market investments are subject to market risks. Always perform your own research or consult a certified SEBI-registered financial advisor before making buy/sell decisions.
Nifty 50 Reclaims 24,300: Technical Analysis & Tomorrow Outl...
NEXTTempsens Instruments IPO Debut (+111%): Analysis & Outlook
Admin
Equity Research & Financial AnalysisCurated by the InvesTalks financial analysis team. Dedicated to providing disciplined stock market insights, technical chart evaluations, and long-term investor education.
 Market News & Outlook
Login to comment.