
Index
- Introduction
- Executive Summary Scorecard: September 25, 2026
- Today's Nifty 50 Market Anatomy (Friday, September 25, 2026)
- Macroeconomic Drivers & Institutional Dynamics
- Deep Multi-Indicator Technical Deconstruction
- Key Support & Resistance Level Grid for Monday, September 28, 2026
- Monday Market Predictions & Decision-Tree Scenarios (September 28, 2026)
- Actionable Strategy & Risk Management Guidelines
Nifty 50 Market Analysis Today (Sept 25: 23,140) & Monday Outlook: Key Levels & Indicators
 By Admin
|
Sep 25, 2026
|
1 min read
|
5
|
🤍
0
By Admin
|
Sep 25, 2026
|
1 min read
|
5
|
🤍
0
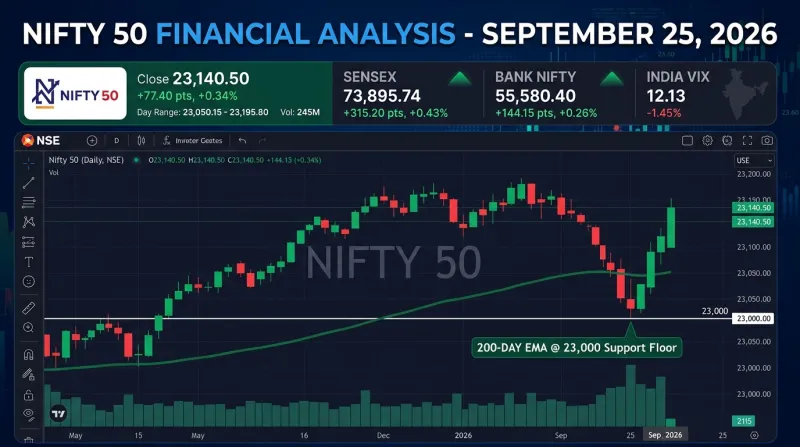
Indian equity benchmarks staged a resilient recovery on Friday, September 25, 2026, as Nifty 50 gained 77.40 points (+0.34%) to close at 23,140.50, successfully defending its crucial 200-day Exponential Moving Average (EMA) support floor. The BSE Sensex rebounded 315.20 points (+0.43%) to settle at 73,895.74, while the Nifty Bank index gained 141.90 points (+0.26%) to 55,580.40, driven by value buying in frontline blue-chips.
This high-value editorial market analysis provides an authoritative breakdown of Friday's price action. We examine the key primary drivers—including massive Domestic Institutional Investor (DII) absorption (+₹3,845.20 Crore net buying against FII selling), easing India VIX (-4.18% to 12.13), and sector rotation favoring Auto, Realty, and Banking.
Heading into Monday, September 28, 2026, this article evaluates deep multi-indicator technical setups—including 200-day EMA support floor defense (23,000–23,050), RSI recovery from oversold levels (35.80), Option Chain Put-Call Ratio (PCR 0.88), Central Pivot Range (CPR) width analysis, and a complete decision-tree scenario matrix to help traders and investors navigate Monday's opening session with strategic clarity.
Executive Summary Scorecard: September 25, 2026
| Market Metric / Index | Friday Close (Sept 25, 2026) | Absolute Change | Percentage Change | Verified Technical & Market Observation |
|---|---|---|---|---|
| Nifty 50 Spot | 23,140.50 | +77.40 pts | +0.34% | Defended 200-day EMA (23,000); High at 23,178.60 |
| BSE Sensex | 73,895.74 | +315.20 pts | +0.43% | Rebounded off previous session lows near 73,500 |
| Nifty Bank | 55,580.40 | +141.90 pts | +0.26% | Recovered above 55,500 floor led by private banking |
| India VIX (Volatility Index) | 12.13 | -0.53 pts | -4.18% | Volatility cooled following Thursday's expiry spike |
| FII Net Cash Flow (Sept 24) | -₹5,027.36 Cr | Net Sellers | Heavy Outflow | Foreign institutional selling continued in cash equities |
| DII Net Cash Flow (Sept 24) | +₹3,845.20 Cr | Net Buyers | Heavy Inflow | Mutual funds injected net liquidity to absorb selling |
| Brent Crude Oil | $104.80 / bbl | Softened | Macro Relief | Crude oil eased slightly from session high of $105.40 |
Today's Nifty 50 Market Anatomy (Friday, September 25, 2026)
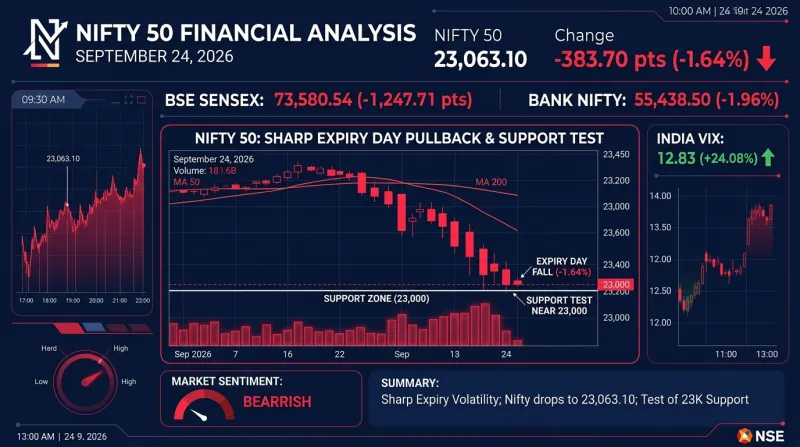
Indian benchmark equities snapped Thursday's sharp selloff on Friday, September 25, 2026, as Nifty 50 rose 77.40 points (+0.34%) to close at 23,140.50, up from the previous settlement of 23,063.10. Opening near lower support at 23,050.20, Nifty dipped briefly to test an intraday low of 23,025.10—right at its 200-day Exponential Moving Average (EMA)—before institutional buying lifted the index to an intraday high of 23,178.60.
The BSE Sensex similarly gained 315.20 points (+0.43%) to close at 73,895.74, while Nifty Bank added 141.90 points (+0.26%) to 55,580.40, supported by selective bargain hunting in large-cap banking, auto, and real estate stocks.
      Intraday Trajectory of Nifty 50 (Sept 25, 2026)

23,178 +----------------------------------------------+ Intraday High: 23,178.60
       |                                      *       |
23,140 |                                     ***      | Close: 23,140.50 (+77.4 pts)
       |                              *******   ***** |
23,080 |                       *******                |
       |  * (Open: 23,050)    *                       |
23,025 +--------*------*------------------------------+ Low: 23,025.10 (200-EMA Floor)
       9:15 AM   11:30 AM          1:45 PM     3:30 PM
Sectoral Performance Dynamics & Capital Rotation
- Outperformers: Nifty Auto (+0.75%), Nifty Realty (+0.65%), and Nifty Bank (+0.26%) anchored Friday's recovery.
- Consolidators: Nifty IT (+0.05%) traded in a flat, defensive range while investors evaluated global technology yield trends.
For real-time sectoral heatmaps and market breadth metrics, explore the InvesTalks Market Insights Hub.
Macroeconomic Drivers & Institutional Dynamics
Friday's market stabilization was shaped by three primary macroeconomic drivers:
- Massive DII Absorption of FII Outflows: Finalized exchange data confirmed that Domestic Institutional Investors (DIIs) bought +₹3,845.20 Crore in net equities on September 24, absorbing heavy foreign net selling (-₹5,027.36 Crore) and protecting structural market levels.
- Cooling India VIX (-4.18%): India VIX eased from Thursday's high to 12.13, signaling a reduction in systemic option hedging anxiety.
- Crude Price Stabilization: Brent Crude stabilized around $104.80/barrel, relieving immediate pressure on energy-sensitive domestic sectors.
Stay informed on global macroeconomic trends via the InvesTalks Stock Market Blog.
Deep Multi-Indicator Technical Deconstruction
Our multi-indicator framework provides deep technical orientation for Monday, September 28, 2026:
1. Moving Average Hierarchy & 200-Day EMA Defense
- 200-Day EMA (23,000–23,050 Zone): Nifty's intraday bounce from 23,025.10 confirmed the 200-day Exponential Moving Average as a formidable long-term structural support floor.
- 20-Day EMA (23,350) & 50-Day EMA (23,390): Remain primary overhead dynamic resistance barriers.
2. Relative Strength Index (RSI - 14 Days) Analysis
- Daily RSI recovered from Thursday's deep oversold reading (29.80) up to 35.80, confirming an emerging momentum bounce with substantial head-room before reaching neutral levels (50).
3. Central Pivot Range (CPR) for Monday, September 28
- Pivot Point (P): 23,114.73
- Bottom Central (BC): 23,101.85
- Top Central (TC): 23,127.61
- CPR Width: Average CPR (~25.76 points).
TIP
Educational Insight on CPR Width: An average Central Pivot Range (~25 points) reflects balanced intraday price action during the previous session. Closing above the CPR Top Central boundary (23,127.61) establishes an intraday bullish bias heading into Monday's opening bell.
4. Option Chain Analysis & Put-Call Ratio (PCR)
- Put-Call Ratio (PCR): Recovered from oversold levels (0.55) up to 0.88, indicating improving sentiment as Put writers added positions at 23,000 PE.
- Call Open Interest (Resistance): Highest Call OI concentrated at 23,200 CE (1.35 crore shares) and 23,300 CE (1.50 crore shares).
- Put Open Interest (Support): Maximum Put OI positioned at 23,100 PE (1.40 crore shares) and 23,000 PE (1.75 crore shares).
        Nifty 50 Option Chain Open Interest Distribution

Call OI (Resistance)                   Put OI (Support)
[23,300 CE] █████████████████████████ 150L
[23,200 CE] ███████████████████ 135L
[23,150 CE] ████████ 55L
---------------------- [23,140 SPOT] ----------------------
                                       ████████████████████ 140L [23,100 PE]
                                       █████████████████████████ 175L [23,000 PE]
                                       ██████████ 80L [22,900 PE]
Analyze live option chain heatmaps and PCR shifts on the InvesTalks Nifty Option Chain Screener.
Key Support & Resistance Level Grid for Monday, September 28, 2026
| Level Type | Price Level (Pts) | Technical Justification & Market Context |
|---|---|---|
| Resistance 3 (R3) | 23,340 | 20-Day EMA Alignment & Heavy Overhead Call Wall |
| Resistance 2 (R2) | 23,250 | Major Swing Resistance & Supply Zone |
| Resistance 1 (R1) | 23,180 | Friday Intraday High (23,178.60) & Immediate Barrier |
| Pivot Point (P) | 23,114 | Daily Central Pivot Point |
| Support 1 (S1) | 23,080 | Immediate Intraday Demand Floor & CPR BC Boundary |
| Support 2 (S2) | 23,000 | 200-Day EMA Floor & Maximum Put OI (1.75 Cr) |
| Support 3 (S3) | 22,920 | Multi-Month Swing Retracement Floor |
Monday Market Predictions & Decision-Tree Scenarios (September 28, 2026)
Based on 200-day EMA support defense and RSI momentum recovery, we outline three probabilistic trading scenarios for Monday, September 28, 2026:

Scenario A: Bullish Rebound Extension (50% Probability)
- Trigger: A flat to positive opening allowing Nifty to trade above 23,140.
- Price Dynamics: A break above 23,180 (R1) triggers short-covering among call writers at 23,200 CE, extending Friday's mean-reversion move.
- Upside Targets: 23,180, extending toward 23,250 (R2).
Scenario B: Base-Building CPR Consolidation (35% Probability)
- Trigger: Flattish opening around 23,114 with option sellers anchoring 23,200 CE and 23,000 PE.
- Price Dynamics: The index consolidates within a corridor between 23,080 and 23,160 to absorb recent volatility.
- Target Range: 23,100 – 23,150.
Scenario C: Bearish Support Re-Test (15% Probability)
- Trigger: Weekend global market weakness or fresh crude oil price spikes.
- Price Dynamics: A break below 23,000 (S2) re-tests the 200-day EMA support floor.
- Downside Targets: 22,950, extending to 22,920 (S3).
Explore advanced technical analysis tools on the InvesTalks Technical Analysis Portal.
Actionable Strategy & Risk Management Guidelines
For Options & Intraday Traders
- Bullish Setup: Enter long positions on a 15-minute candle closing above 23,150, targeting 23,200 and 23,250. Enforce a strict stop-loss below 23,090.
- Pullback Buying: Accumulate long positions near 23,025–23,050 if bullish reversal candlesticks form near the 200-day EMA floor. Set a stop-loss below 22,980.
- Volatility Adjustment: With India VIX cooling to 12.13, option buyers benefit from lower vega risks during directional momentum moves.
For Long-Term Investors
- Nifty's defense of the 200-day EMA floor (23,000–23,050) reaffirms structural bull market stability. Continue systematic equity accumulation in fundamental large-cap market leaders.
❓ Frequently Asked Questions (FAQs)
The 200-day Exponential Moving Average (EMA) serves as the benchmark long-term structural trendline. In technical analysis, institutional buyers frequently step in at the 200-EMA during major pullbacks to defend broader bull market dynamics.
When Domestic Institutional Investors (DIIs) inject large net capital during selloffs, domestic mutual fund flows absorb foreign institutional selling (FIIs), preventing systemic panic and stabilizing stock prices at key technical supports.
Nifty 50 closed at 23,140.50, gaining 77.40 points (+0.34%), rebounding from Thursday's close of 23,063.10.
The BSE Sensex closed at 73,895.74, up by 315.20 points (+0.43%).
An India VIX reading of 12.13 reflects a cooling volatility regime. Lower VIX levels lower option premiums, reducing risk for option buyers while requiring disciplined strike selection for option sellers.
Key support levels stand at S1: 23,080, S2: 23,000 (200-day EMA), and S3: 22,920. Primary resistance levels are R1: 23,180, R2: 23,250, and R3: 23,340.
Financial & Regulatory Disclaimer
InvesTalks provides stock market analysis, equity research, and financial content strictly for educational and informational purposes only. We are not a SEBI-registered investment advisor or portfolio manager. Market investments are subject to market risks. Always perform your own research or consult a certified SEBI-registered financial advisor before making buy/sell decisions.
Admin
Equity Research & Financial AnalysisCurated by the InvesTalks financial analysis team. Dedicated to providing disciplined stock market insights, technical chart evaluations, and long-term investor education.
 Market News & Outlook
Login to comment.