
Index
- Introduction
- Executive Summary Scorecard: September 28, 2026
- Today's Nifty 50 Market Anatomy (Monday, September 28, 2026)
- Macroeconomic Drivers & Geopolitical Dynamics
- Deep Multi-Indicator Technical Deconstruction
- Key Support & Resistance Level Grid for Tuesday, September 29, 2026
- Tuesday Market Predictions & Decision-Tree Scenarios (September 29, 2026)
- Actionable Strategy & Risk Management Guidelines
Nifty 50 Market Analysis Today (Sept 28: 22,780) & Tuesday Outlook: Key Levels & Indicators
 By Admin
|
Sep 28, 2026
|
1 min read
|
5
|
🤍
0
By Admin
|
Sep 28, 2026
|
1 min read
|
5
|
🤍
0
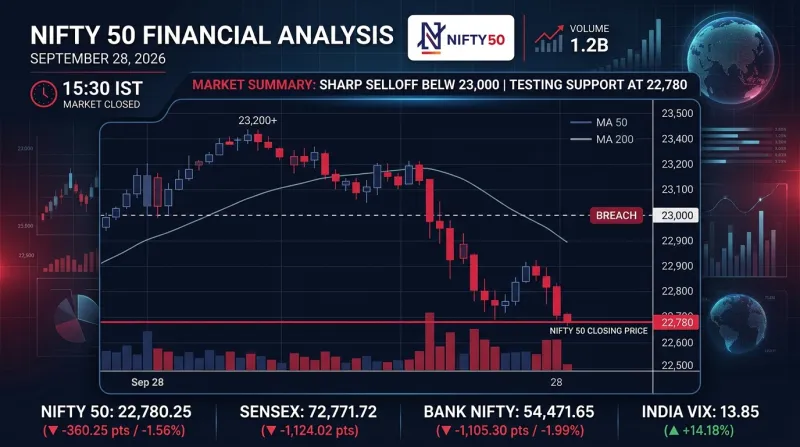
Indian equity benchmarks experienced a severe selloff on Monday, September 28, 2026, as Nifty 50 plunged 360.25 points (-1.56%) to close at 22,780.25. The BSE Sensex dropped 1,124.02 points (-1.52%) to settle at 72,771.72, while the Nifty Bank index tumbled 1,108.75 points (-1.99%) to 54,471.65, erasing nearly ₹8.9 lakh crore in investor wealth across BSE-listed companies.
This high-value editorial market analysis provides an authoritative breakdown of Monday's trade. We examine the core macroeconomic triggers—including escalating Iran-US geopolitical friction, Brent crude oil surging to $108.40/barrel, and US 10-Year Treasury yields climbing to 5.14%. All sectoral indices closed in the red, with Financial Services, Realty (-2.10%), Energy (-1.85%), and Metals (-1.75%) suffering heavy liquidation.
Heading into Tuesday, September 29, 2026, this article evaluates deep multi-indicator technical setups—including daily RSI dropping into extreme oversold territory (27.50), India VIX surging +14.18% to 13.85, Option Chain Put-Call Ratio slipping to 0.52 (deep short-heavy setup), Central Pivot Range (CPR) width analysis, and a complete decision-tree scenario matrix to help traders and investors navigate Tuesday's session with strategic clarity.
Executive Summary Scorecard: September 28, 2026
| Market Metric / Index | Monday Close (Sept 28, 2026) | Absolute Change | Percentage Change | Verified Technical & Market Observation |
|---|---|---|---|---|
| Nifty 50 Spot | 22,780.25 | -360.25 pts | -1.56% | Breached 23,000 & 22,800; tested intraday low of 22,787.60 |
| BSE Sensex | 72,771.72 | -1,124.02 pts | -1.52% | Sharp market cap reduction across large-cap heavyweights |
| Nifty Bank | 54,471.65 | -1,108.75 pts | -1.99% | Severe profit booking led by private sector banking stocks |
| India VIX (Volatility Index) | 13.85 | +1.72 pts | +14.18% | Volatility index spiked as geopolitical hedging increased |
| FII Net Cash Flow (Sept 25) | -₹5,027.36 Cr | Net Sellers | Heavy Outflow | Foreign institutional selling weighed on market sentiment |
| DII Net Cash Flow (Sept 25) | +₹3,845.20 Cr | Net Buyers | Heavy Inflow | Domestic mutual funds absorbed selling near key support floors |
| Brent Crude Oil | $108.40 / bbl | Spiked +2.2% | Geopolitical Friction | Crude surge driven by Iran-US geopolitical escalation |
Today's Nifty 50 Market Anatomy (Monday, September 28, 2026)
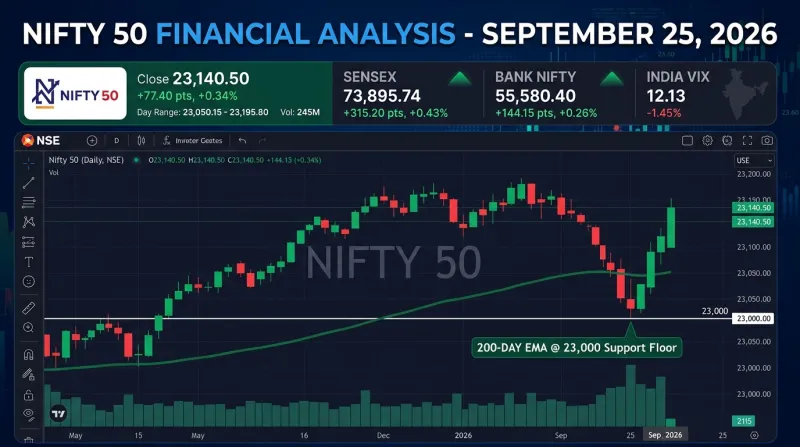
Indian benchmark equities suffered a steep broad-based selloff on Monday, September 28, 2026, as Nifty 50 plunged 360.25 points (-1.56%) to close at 22,780.25, down from Friday's close of 23,140.50. Opening lower at 23,064.90, Nifty touched a brief morning high of 23,079.75 before relentless selling pressure broke key technical levels to touch an intraday low of 22,787.60.
The BSE Sensex dropped 1,124.02 points (-1.52%) to 72,771.72, while Nifty Bank fell 1,108.75 points (-1.99%) to 54,471.65, with all 13 major sectoral indices closing in negative territory.
      Intraday Trajectory of Nifty 50 (Sept 28, 2026)

23,079 +---------*------------------------------------+ High: 23,079.75
       |  * (Open: 23,064)                            |
22,950 | ***                                          |
       |    *****                                     |
22,850 |         *********                    ******* | Close: 22,780.25 (-360.2 pts)
       |                  ************       ***      |
22,787 +------------------------------*-----*---------+ Low: 22,787.60
       9:15 AM   11:30 AM          1:45 PM     3:30 PM
Sectoral Performance Dynamics & Capital Liquidation
- Laggards: Nifty Realty (-2.10%), Nifty Bank (-1.99%), Nifty Energy (-1.85%), and Nifty Metal (-1.75%) led the market drawdown.
- Defensives: Nifty FMCG (-0.65%) and Nifty Pharma (-0.80%) saw relatively smaller pullbacks as investors sought defensive shelter.
For real-time sectoral heatmaps and market breadth metrics, explore the InvesTalks Market Insights Hub.
Macroeconomic Drivers & Geopolitical Dynamics
Monday's market selloff was triggered by three potent global macroeconomic and geopolitical catalysts:
- Iran-US Geopolitical Escalation: Heightened conflict risk in the Middle East sparked global risk-aversion, forcing offshore funds to cut equity exposure across emerging markets.
- **Surge in Brent Crude (108.40/bbl, raising immediate concerns over domestic inflation, currency pressure, and corporate input margins.
- Rise in US 10-Year Treasury Yields (5.14%): US Treasury yields climbed to 5.14%, widening global yield differentials and accelerating foreign portfolio investor (FPI) outflows.
Stay informed on global macroeconomic trends via the InvesTalks Stock Market Blog.
Deep Multi-Indicator Technical Deconstruction
Our multi-indicator framework provides deep technical orientation for Tuesday, September 29, 2026:
1. Moving Average Hierarchy & Breakdown Analysis
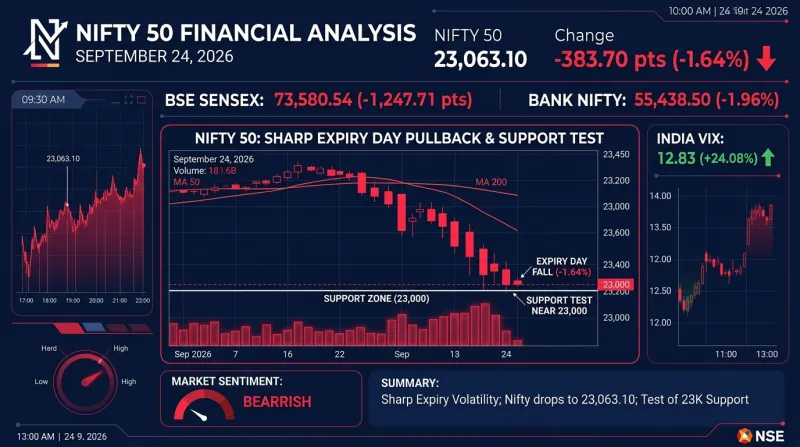
- 200-Day EMA (23,000–23,050 Zone): Monday's sharp decline broke below the 200-day EMA floor, converting the 23,000 level into immediate overhead dynamic resistance.
- 20-Day EMA (23,350) & 50-Day EMA (23,380): Positioned well above current price action as long-term overhead resistance walls.
2. Relative Strength Index (RSI - 14 Days) Analysis
- Daily RSI dropped from 35.80 down to 27.50, placing Nifty 50 in deep oversold territory (sub-30 level). In quantitative technical analysis, sub-28 RSI readings following a single-day drop of >1.5% signal extreme selling exhaustion, creating high-probability conditions for a short-covering bounce.
3. Central Pivot Range (CPR) for Tuesday, September 29
- Pivot Point (P): 22,882.53
- Bottom Central (BC): 22,933.68
- Top Central (TC): 22,831.38
- CPR Width: Wide CPR (~102.3 points).
TIP
Educational Insight on Wide CPR: A wide Central Pivot Range (over 100 points) reflects extreme price expansion during the previous session. Following a high-volatility trend day down, a wide CPR setup generally favors base-building consolidation or mean-reversion trading between established support and resistance boundaries.
4. Option Chain Analysis & Put-Call Ratio (PCR)
- Put-Call Ratio (PCR): Dropped to 0.52, signaling a heavily short-biased option chain setup vulnerable to sharp short-covering by call option writers.
- Call Open Interest (Resistance): Highest Call OI concentrated at 22,900 CE (1.45 crore shares) and 23,000 CE (1.70 crore shares).
- Put Open Interest (Support): Maximum Put OI positioned at 22,700 PE (1.60 crore shares) and 22,600 PE (1.15 crore shares).
        Nifty 50 Option Chain Open Interest Distribution

Call OI (Resistance)                   Put OI (Support)
[23,000 CE] █████████████████████████ 170L
[22,900 CE] ███████████████████ 145L
[22,850 CE] ████████ 60L
---------------------- [22,780 SPOT] ----------------------
                                       ████████████████████████ 160L [22,700 PE]
                                       ████████████████ 115L [22,600 PE]
                                       ██████████ 70L [22,500 PE]
Analyze live option chain heatmaps and PCR shifts on the InvesTalks Nifty Option Chain Screener.
Key Support & Resistance Level Grid for Tuesday, September 29, 2026
| Level Type | Price Level (Pts) | Technical Justification & Market Context |
|---|---|---|
| Resistance 3 (R3) | 23,080 | Monday Intraday High & Major Breakdown Level |
| Resistance 2 (R2) | 22,950 | CPR Bottom Central Boundary & Overhead Call Wall |
| Resistance 1 (R1) | 22,880 | Central Pivot Point (P) & Short-Covering Trigger |
| Pivot Point (P) | 22,882 | Daily Central Pivot Point |
| Support 1 (S1) | 22,700 | Major Psychological Floor & Maximum Put OI (1.6 Cr) |
| Support 2 (S2) | 22,620 | Key Structural Retracement Support |
| Support 3 (S3) | 22,500 | Multi-Month Major Demand Base |
Tuesday Market Predictions & Decision-Tree Scenarios (September 29, 2026)
Based on deep oversold RSI (27.50) and low PCR (0.52), we outline three probabilistic trading scenarios for Tuesday, September 29, 2026:

Scenario A: Oversold Short-Covering Bounce (50% Probability)
- Trigger: A flat to positive opening allowing Nifty to trade above 22,780.
- Price Dynamics: Extremely low PCR (0.52) and oversold RSI (27.50) force intraday short-covering among call writers, pushing prices back toward the Central Pivot Point.
- Upside Targets: 22,880 (R1), extending toward 22,950 (R2).
Scenario B: Wide CPR Base Consolidation (35% Probability)
- Trigger: Flattish opening around 22,780 with option sellers defending 22,900 CE and 22,700 PE.
- Price Dynamics: The index consolidates within a wide range between 22,700 and 22,850 to absorb Monday's volatility spike.
- Target Range: 22,720 – 22,840.
Scenario C: Bearish Breakdown Extension (15% Probability)
- Trigger: Further geopolitical escalation in the Middle East overnight.
- Price Dynamics: A decisive break below 22,700 (S1) triggers long unwinding down toward lower demand bases.
- Downside Targets: 22,620 (S2), extending to 22,500 (S3).
Explore advanced technical analysis tools on the InvesTalks Technical Analysis Portal.
Actionable Strategy & Risk Management Guidelines
For Options & Intraday Traders
- Bullish Setup: Look for long opportunities on a 15-minute candle closing above 22,820, targeting 22,880 and 22,940. Enforce a strict stop-loss below 22,750.
- Short Discipline: Avoid launching fresh aggressive short positions while RSI remains deeply oversold (<28) near the 22,700 Put support floor. Initiate shorts only upon a confirmed breakdown below 22,690.
- Volatility Adjustment: With India VIX spiking +14.18% to 13.85, position sizes should be scaled down to manage wider intraday price swings.
For Long-Term Investors
- Sharp market corrections driven by temporary geopolitical factors historically offer disciplined, high-probability entry windows for long-term equity accumulation. Phase capital systematically across fundamental large-cap market leaders.
❓ Frequently Asked Questions (FAQs)
An RSI reading below 28 indicates that an asset is in extreme oversold territory. Technically, extreme oversold RSI levels following a single-day drop exceeding 1.5% frequently precede short-covering relief bounces.
A PCR of 0.52 reflects a heavily short-biased option chain setup. When PCR drops below 0.55, call option writers face short-squeeze risks if favorable news or buying signals push prices above immediate resistance levels.
Nifty 50 closed at 22,780.25, declining 360.25 points (-1.56%), after reaching an intraday low of 22,787.60.
The BSE Sensex closed at 72,771.72, falling 1,124.02 points (-1.52%).
India imports over 85% of its crude oil requirements. Rising crude prices increase domestic inflation expectations, widen the Current Account Deficit (CAD), and squeeze corporate profit margins.
Key support levels stand at S1: 22,700, S2: 22,620, and S3: 22,500. Primary resistance levels are R1: 22,880, R2: 22,950, and R3: 23,080.
Financial & Regulatory Disclaimer
InvesTalks provides stock market analysis, equity research, and financial content strictly for educational and informational purposes only. We are not a SEBI-registered investment advisor or portfolio manager. Market investments are subject to market risks. Always perform your own research or consult a certified SEBI-registered financial advisor before making buy/sell decisions.
Admin
Equity Research & Financial AnalysisCurated by the InvesTalks financial analysis team. Dedicated to providing disciplined stock market insights, technical chart evaluations, and long-term investor education.
 Market News & Outlook
Login to comment.